IBM Cognos Workspace Advanced
Cognos Workspace Advanced is a self-service authoring tool. It is the ad-hoc query and analyses interface for business users. It provides self-service authoring by bringing together the best of Query Studio, Analysis Studio, and Report Studio features suited for business users, thus enabling them to use a rich set of reporting capabilities—all in one place. It replaces and extends Report Studio Express available in Cognos 8 and brings enhanced reporting capabilities and financial statement-style reports in Cognos Workspace Advanced.
Following are key capabilities of Cognos Workspace Advanced:
• Integrated Data Exploration and Analysis: You can perform data analysis by applying filters and calculations, top/bottom analysis, drill up/down, and so on.
• Multiple Query Objects and Enhanced Format/Layout Capabilities: Cognos Workspace Advanced has enhanced formatting, layout, and distribution options. You can work with charts, lists, crosstabs, and financial statement-style reports. Users can also apply conditional highlighting to highlight exception values as red/green or in a way appropriate to their business.
• Multiple Data Sources Supported: You can create your Cognos Workspace Advanced reports using any of the supported data sources. You can build your report using Dimensional, Relational, Online Analytical Processing (OLAP) data source, and data from an external flat files like spreadsheets, text files, comma-separated files, or XML files with your existing Cognos content.
• Enhanced Charting Capabilities: The new charting options available in Report Studio enable you to choose from a wide variety of charts. You can either continue working with the legacy charting option available in Cognos 8 or use new enhanced charting options available in IBM Cognos BI v10.x. Cognos Workspace Advanced uses the new capability by default; this can be overridden in the Options menu, discussed later in the chapter.
• Single Report Specification for Cognos Workspace and Report Studio: Cognos Workspace Advanced is built on top of Report Studio and provides a full, round-trip integration with Report Studio. You can open and modify a Cognos Workspace Advanced report in Report Studio and Report Studio report in Cognos Workspace Advanced, thus providing reusability and ease of maintenance. The key point to remember is that Cognos Workspace Advanced gives the business authors flexibility to create complex reports that enable grouping, sectioning, breaking data into logical pages, as well as create complex queries and filter conditions. It provides a rich range of charting options to address the diverse needs of advanced business users who go beyond dragging and dropping existing content onto the workspace. If you are familiar with Report Studio, think of Cognos Workspace Advanced as a subset of Report Studio capabilities presented in an easy-to-use interface.
COGNOS WORKSPACE ADVANCED AUDIENCE/USERS
Cognos Workspace Advanced is best suited for users who perform data exploration, analyses, and ad-hoc queries, or create statement-style financial reports. It is for Business Authors who need to create a report that enables them to explore the data and present it in the form of a chart, list, crosstab, or financial statement-style reports with the capability of in-place analyses.
In addition, Business Authors can create complex calculations to enhance their reports and combine the trusted corporate data with external data like benchmark data or other market values for comparison, which may be available to them in a flat file.
Cognos Workspace Advanced replaces Report Studio Express in IBM Cognos 8. If you upgrade from Cognos 8 to Cognos v10, you can continue to use Query Studio and Analysis Studio. For new reports or groups of users, you can consider Cognos Workspace Advanced as the starting point and tap into the enhanced features of Cognos Workspace Advanced.
DATA SOURCES AND CONTENT
Cognos Workspace Advanced uses metadata from a package to build the report content. The package is created by IBM Cognos Metadata Modeler based on your reporting requirement. A package typically consists of data from underlying database tables or OLAP source.
The Metadata Modeler may package the metadata dimensionally or relationally depending upon your reporting needs. Data required to build a Cognos Workspace Advanced report can come from any supported data source that can be modeled as relational or dimensionally modeled relational (DMR) data.
In addition, you can combine your existing corporate data from a package with external file data, for example, benchmark data or other market survey data for comparison and analysis. Working with external file data is discussed in detail later in the chapter.
Launching Cognos Workspace Advanced
• From Cognos Workspace using the Do More... button
• From the Launch menu in the IBM Cognos Connection
• From the Welcome page via the Author Business Reports option
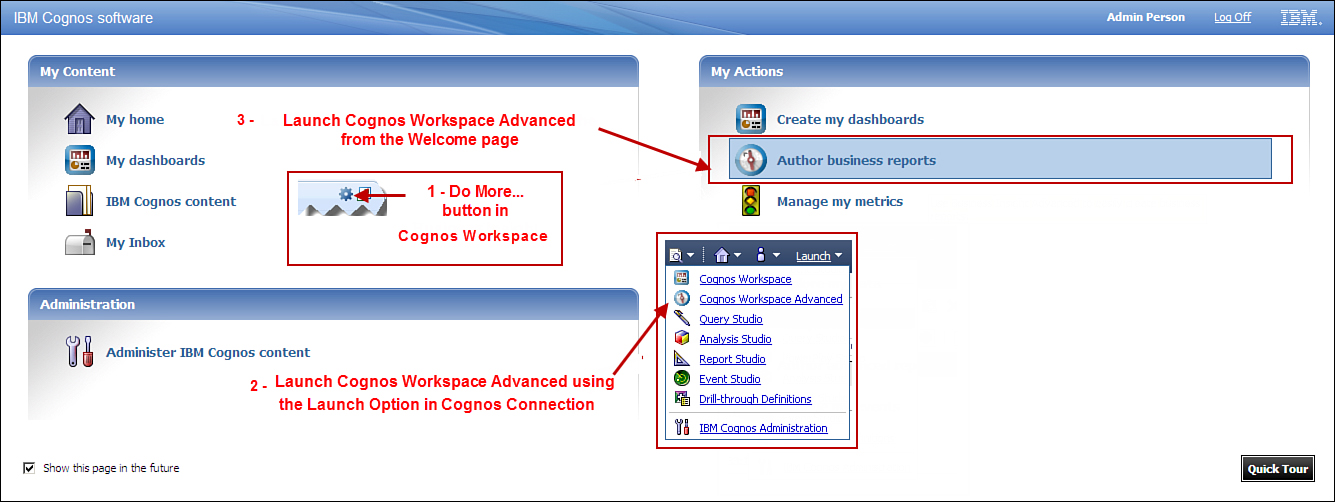
Figure 9.1. Three ways to launch IBM Cognos Cognos Workspace Advanced.
Functionality available to you in Cognos Workspace Advanced is different if you launch Cognos Workspace Advanced directly using the last two options as compared to using the Do More... button from Cognos Workspace. Certain features and functionalities are not available to you from Cognos Workspace; for example, you cannot reposition the content pane or save the modified report to a new location when launched from within Cognos Workspace using Do More.....
By default, when you launch Cognos Workspace Advanced the report page opens in Page Previewmode, which enables you to see sample data in the report as you build it. However, you can choose to work in Page Design mode and Run the report later to view the data. In either case to see all the data in the report, you must Run the report. Using the Start Page View option, open in Page Preview orPage Design mode. To change the setting choose Tools > Options > View, and choose optionDesign or Preview from the drop-down list Start page view. For the change to take effect, exitCognos Workspace Advanced and launch it again.
WORKING WITH COGNOS WORKSPACE ADVANCED PACKAGES AND REPORTS
When you launch Cognos Workspace Advanced, you are prompted to select a package. A package is collection of metadata logically/functionally grouped together to support your reporting requirement, as shown in Figure 9.2.
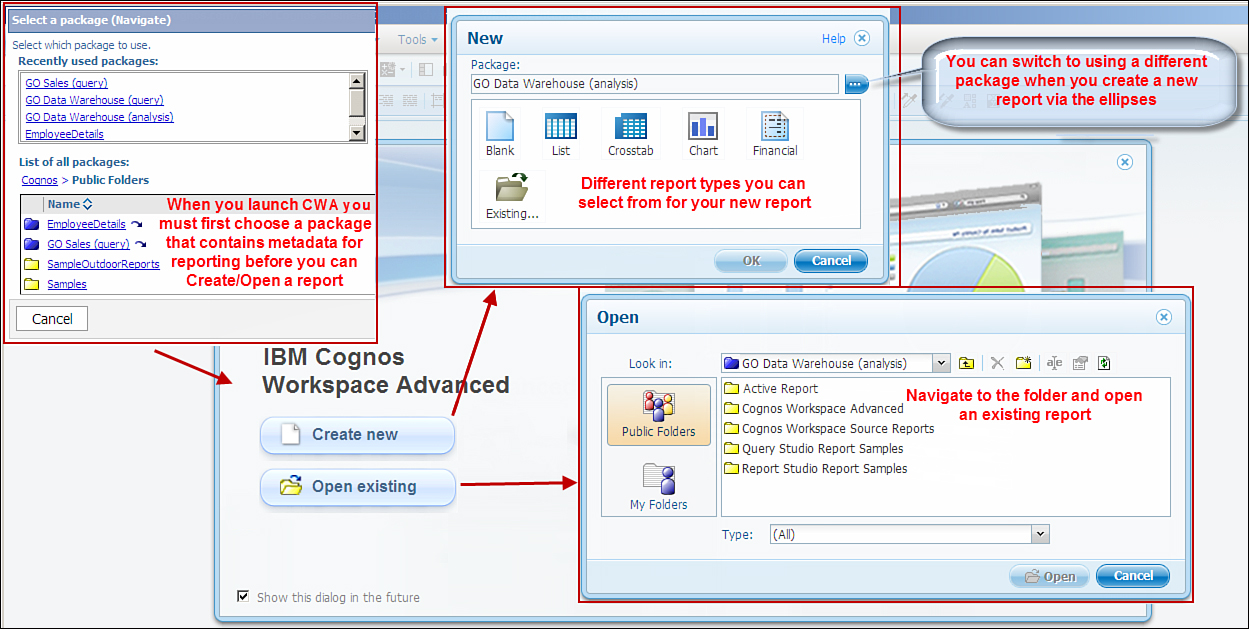
Figure 9.2. Create a new report in Cognos Workspace Advanced.
Packages are created using IBM Cognos Framework Manager. For example, the data in an organization can be grouped functionally for the Human Resource department, Finance department, or Marketing department. Although all the data belongs to the same organization, a certain set of data is more meaningful for the Human Resource department, whereas others for Finance department and still others for the Marketing department. It is not uncommon to find overlap between them. There is no right way to package the data together; it is guided by the organization’s business and reporting requirements.
If you do not already know which package holds the data for your reporting needs, you can consult your IBM Cognos Framework Manager user (Metadata Modeler) or IBM Cognos BI Administrator.
A report can be associated with only one package at a time, so you must ensure that data items you require to build your report have been logically packaged together. Packages may also contain commonly used filters and calculations used by you or others in one or more reports.
It is common that the package is updated with new information as time goes by. When you open your report, the report automatically uses the latest package information. If you already have the report open and want to ensure that the latest package information is used, you can click the Refresh icon on the Source tab.
REPORTING STYLES AND LAYOUTS
Depending on your audience and data source, you must choose a reporting style and layout that is easy to read and understand. There is no right reporting style or layout for any particular audience; it is guided by preferences of the audience of your report. Generally speaking, reports designed for executives are dashboard or chart styles that provide quick, high-level information, while for business users and analysts who are interested in seeing the detailed data for their analyses may prefer List or Crosstab report layouts.
Reporting Styles
Cognos Workspace Advanced supports diverse reporting needs of a global audience. You can choose from a dimensional reporting style or relational reporting style to build your reports. The relational reporting style enables you to create simple and complex reports and is designed for an audience that does not have needs to drill up and drill down the data in the report. However, if your reporting needs require users to drill up and drill down the data in the report, you should consider using the dimensional reporting style. In addition, for dimensional reports, the metadata must be modeled dimensionally to allow drill-up/drill-down capability.
Although as an end user all you may need to know is where the metadata resides, understanding your options allows you to use the different capabilities available with each of the reporting style. Options available to you for analyses in each reporting style may vary in the two reporting styles. For example, you notice that there are some additional options like Explore, Create Page Layers, and so on that are only available to you in dimensional reporting style, discussed in the section “Working with Dimensional Style Reports.” One is not better than the other; the choice is typically guided by your reporting needs.
In a new implementation, it is good to understand your reporting needs upfront because it forms the basis for the approach the Cognos Metadata Modeler should take to build the model for your reporting package.
Relational Style
To create relational style reports use relational data sources. List, Crosstab, and Chart report layouts are suitable report layouts when working with relational data.
On the Source tab the metadata tree is organized in Namespaces, which contain Query Subjects. Query Subjects are like tables in a database that contain logically related items together. Query Subjects consist of one or more Query Items. You can compare Query Items to columns in a table. You may either drag and drop the entire Query Subject or selected query items in to your List report, as shown inFigure 9.3.

Figure 9.3. Relational report using objects from a Relational model.
Looking at Figure 9.3, the report displays data in a tabular format and does not provide drill-up and drill-down capability. When drill-up and drill-down capability is available, the items in the report appear as a link, and you will see this later in dimensional style reporting.
You can drill through to another report that may provide additional details on the summaries to support your analysis. Drill-through reports are set up by the report author and predefined for use. Although you can enable or disable usage of a drill-through report from Cognos Workspace Advancedusing Data menu > Drill Options... > check/uncheck the Allow this report to be package-based drill-through source.
Dimensional Style
To work with dimensional style reports, you should work with dimensionally modeled relational data sources or OLAP data sources. When working with dimensional style, the source tab shows dimensions and members in the data tree, as shown in Figure 9.4 and described in the list that follows.

Figure 9.4. Dimensional report using objects from a Dimensional model.
• Namespaces: Logical/functional grouping of dimensions and measures
• Dimensions: Logical grouping of descriptive data that aligns with a business function, such as Branch, Order Method, Products, and so on
• Level Hierarchy: Further grouping of data within the dimension
• Members Folder: Contains members for the hierarchy or level
• Level: Defines the position within the dimensional hierarchy that contains information at the same level of detail with common attributes
Dimensions, measures, hierarchies, and so on. are explained in further detail in Chapter 11, “IBM Cognos Framework Manager.”
Crosstabs and charts are commonly used when working with dimensional data.
From the Source tab, you can add a level, select specific members from different levels in the same hierarchy, and add a member by itself, children of the member or member, and its children to your report.
When working with dimensional style reports, you can define drill through by member, and because the data is modeled dimensionally, you can also drill up and drill down the data for further analyses. Although drill up and drill down is the default behavior of a dimensional report, you can enable/disable it for the currently opened report via Data menu > Drill Options... > check/uncheck Allow drill-up and drill-down check box.
IBM Cognos Analysis Studio uses dimensionally modeled data.
REPORT LAYOUTS
Cognos Workspace Advanced enables you to work with various report layouts, as shown in Figure 9.5. You can choose the most appropriate layout for your audience. Each report layout is briefly discussed in the list that follows to help you determine which one may be suited for your needs.

Figure 9.5. Report output types available in Cognos Workspace Advanced—with sample displays.
• Blank: Starts with a blank report, on which you can drag and drop objects from the Toolbox andSource tab to build your report from scratch. It is commonly used to create templates with reusable objects, for example, a company logo, standard header, and footer that can be used as a starting point for building reports.
• List: A good option when you want to display detailed information in a tabular format. By default, repeated information displays multiple times until you group the data on one or more repeated columns as needed for your reports. Use Group/Ungroup option from the toolbar. List reports are generally used with relational data.
• Crosstab: Ideal for matrix type report where you can have data items in rows and columns and a numeric value, that is, a measure/metric in the intersection cells. Row and column values are typically descriptive data items, for example, Product line, Region, and so on. You can nest a Crosstab report by adding rows and columns or even measures.
• Chart: Displays data graphically. Charts are best suited for showing key information quickly. There are many chart types available to you. Some of them are discussed in section “Working with Charts” later in this chapter.
• Financial: Creates statement-style reports. This is similar to what you create using Report Studio Express in IBM Cognos 8.
• Existing: Creates a new report using an existing report whose report layout you want to copy. The new report uses the same underlying data structure/package. The new report uses the same package as the existing report, retains the report title, and provides the same report layout, such as Crosstab and List as used by the existing report.
OPENING AN EXISTING REPORT
Use the Open option to work with an existing report. Open the report to manage, maintain, or make a copy of an existing report (refer to Figure 9.2).
To open a report, perform the following steps:
1. In Cognos Connection, click Launch > Cognos Workspace Advanced.
2. In Select a Package window, choose Public Folders > Great Outdoors Samples > Samples > Models > Go Data Warehouse (query).
NOTE: Alternatively, you can launch Cognos Workspace Advanced from the Welcome page.
3. Click Open existing button to open an existing report.
4. Navigate to Go Data Warehouse (query) package > Cognos Workspace Advanced folder > Retailers sales target report (or any report available in this location).
Examine the options and content in the Source tab. The content is organized in namespaces, folders, and query subjects. Prebuilt filters are also available in the filters folder.
Examine the Work Area; you see the data in the report without running the report—the View option is set to Page Preview unlike in Design mode where you must run the report to see the actual data in the report.
EXPLORING THE COGNOS WORKSPACE ADVANCED USER INTERFACE
This section familiarizes you with the Cognos Workspace Advanced user interface. Examine Figure 9.6that highlights the Cognos Workspace Advanced user interface, which consists of the following areas and options:
• Work area
• Content pane
• Properties pane
• Page Layers area
• Context Filter area
• Source tab
• Toolbox tab
• Page Navigation
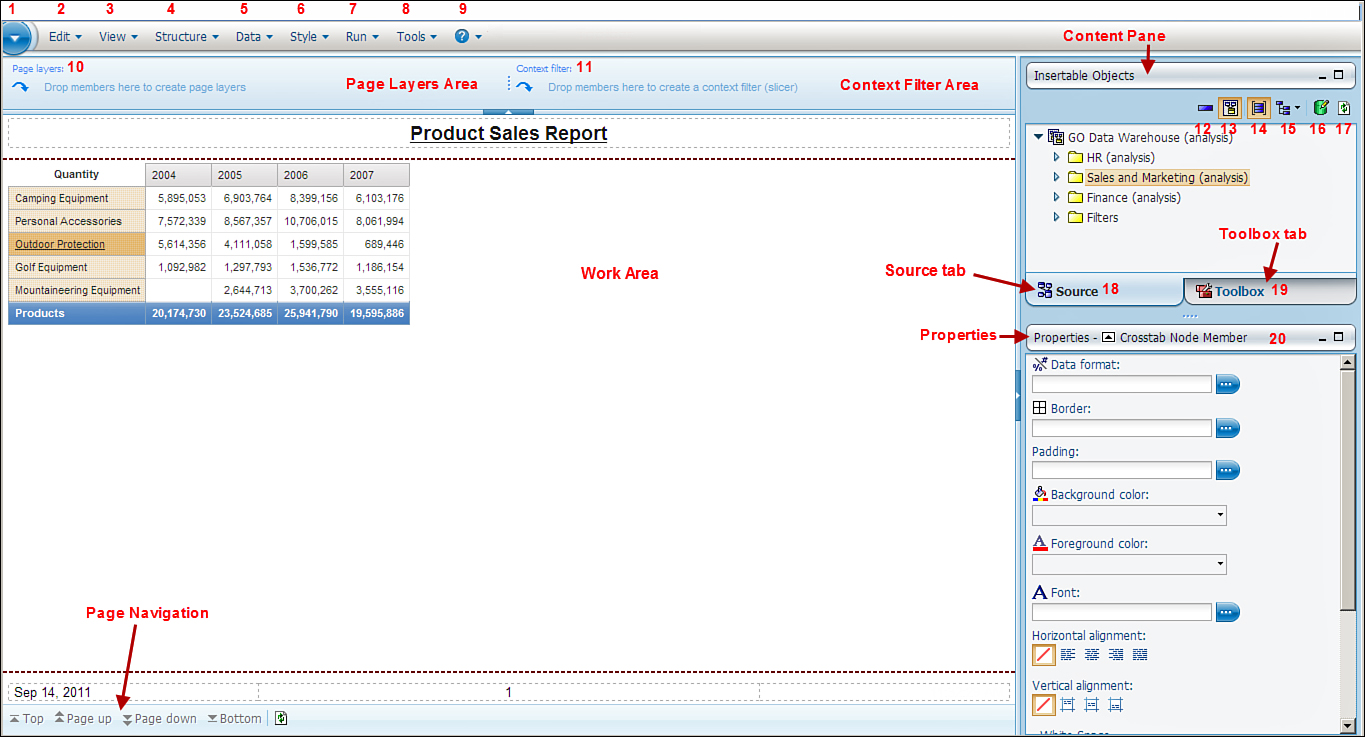
Figure 9.6. High-level user interface options in Cognos Workspace Advanced.
The Work Area is where you build your report. By default, the data in the report is live; however, you can switch to design mode, which enables you to see the data placeholders rather than live data in the report. You can switch between the Page Design and Page Preview modes via the View option on the toolbar.
The Content pane contains the objects to build your reports. You can simply drag and drop objects from the Content pane onto the Work Area to build your report. By default, the Content pane is available to you on the right side of the screen. You can reposition the pane onto the left of the screen via Tools > Options > View tab and launch Cognos Workspace Advanced again for the change to take effect.
Page Navigation options are available at the bottom of the page:
• Top enables you to quickly jump to the first page.
• Page up enables you to go to the previous page.
• Page down enables you to navigate to the next page.
• Bottom enables you to quickly navigate to the last page of the report.
• You can also refresh the page using the refresh icon (to the right of the Bottom link).
High-level Cognos Workspace Advanced user interface options are explained in the following list with numbers corresponding to how they are displayed in Figure 9.6.
1. Report Actions menu: This menu provides basic functionalities such as the following:
• New enables you to create a new Cognos Workspace Advanced report.
• Open enables you to work with an existing report.
• Save enables you to save your work for later use.
• Save as.... enables you to save the currently opened report with another name.
• PDF Page Setup... enables you to define the page orientation as Portrait or Landscape, and Paper Size (Default, Custom, Letter, Legal, 11x17, A3, A4, B4 JIS, B5 JIS). If you choose the option Custom for Paper Size, you must define the Width and Height in cm/in.
• Report Properties enables you to pick a Report Style (1.x styles, 8.x styles, 10.x styles, and Simplified styles). 10.x style is the default.
• Log on enables you to log on to the Cognos BI environment using a valid userid/password.
• Log Off enables you to log off from the Cognos BI environment. You can log on again using the Log on link.
• Exit takes you out of Cognos Workspace Advanced.
2. Edit menu provides the following options:
• Undo enables you to undo recent changes made to the report.
• Redo enables you to redo a change that you undid using Undo.
• Cut enables you to cut an object/item from the report.
• Copy enables you to copy a report item to the report.
• Paste enables you to paste a copied report item in the report.
• Paste To... provides three options: Insert before enables you to paste the copied item before the currently selected item; Insert after enables you to paste the copied item after the currently selected item; and Insert inside enables you to paste the copied item inside the currently selected item.
• Delete enables you to delete the currently selected item from the report.
3. View menu has options that enable you to change the Cognos Workspace Advanced user interface to suit your needs. It has the following options:
• Page Design enables you to see the data containers rather than the data in the report as you build it. You must run the report to see the data in the report, in the Page Design mode.
• Page Preview enables you see the portion of the data in the report as you assemble it. You must run the report to see the complete data in the report.
• Toolbars option enables you to show/hide the Standard Toolbar and Style Toolbar.
• Visual Aids options are helpful tools when designing your report layout, with four toggle options that help you with report formatting and layout:
• Show Boundary Lines option overrides the boundary line settings that you currently have with the default dotted lines.
• Show Page Header & Footer option enables you to enable/disable the header and footer in the report.
• Show Drag & Drop Padding option enables you to enable/disable the drag-and-drop zone when the Padding property of an object is set to 0.
• Show Container Selectors option enables you to hide/show the three orange dotted selectors that appears on top left of a List, a Crosstab, and Tables.
• Preview Options... enables you to specify the number of rows to display per page in Page Previewmode.
4. Structure provides options that impact the structure of the report:
• Group/Ungroup enables you to group the data and remove duplicate values from a List report that is, repeated values appear only once when the column is grouped. You can group data on more than one column. When the column is grouped, it automatically moves to the left of the list. You can ungroup a grouped column by first selecting the grouped column and then clicking Group/Ungroup; this ungroups the data, and duplicate values appear again in the list.
• Swap Rows and Columns enables you to switch the rows in your report to columns and columns to rows. This option is handy when you want to look at the same data in a different perspective. This option is valid for a crosstab and chart. Using this option in a chart switches the x- and y-axes values.
• Headers & Footers enables specifying and defining a header and footer for your report. Headers and footers are optional; you may either have both, one or none. If you need the header you must check the box for Header and similarly for Footer. Doing this displays the header and footer locations on the report page. You can drag and drop items like text, images, date, page numbers, expressions, and so on from the Toolbox tab to define how the header and footer should look in the report.
• Pivot List to Crosstab enables you to change a List into a Crosstab report. This option is handy when you want to view the same data in a different perspective. Before you choose this option, you must first click the column that you want to appear as a column names, or the column edge in the Crosstab report, and then click Pivot List to Crosstab. The unselected columns in the list, with the exception of the measures, appear as rows or nested rows. If the list has more than one measure, they appear as columns.
5. Data menu options are context-sensitive, for example, options available to you differ if you work with a List or a Crosstab and also if the data source you use is relational or dimensional. This is because certain functionality is only applicable to dimensional reporting. Also, the options will be enabled or disabled in the menu depending upon the currently selected object in the report; if certain options are disabled, you must ensure that the cursor context is correct.
6. Style enables you to define a style, for example, the background color, foreground color, horizontal alignment, vertical alignment, data format, padding, and border and font. From here you can also define Conditional Styles, for example, define high and low values in the report and color them as required, such as low values in red and high values in green or as applicable.
7. Run Options enables you to run the report to view the latest data for the report. You can pick the report output format, for example, HTML (default), PDF, Excel 2007, Excel 2002, Delimited Text (CSV), and XML. From here you can also specify the Paper size, Paper orientation, Data mode (All Data, Limited Data, and No Data), Language for the report, Rows per page, and so on.
8. Tools menu provides you with additional tools to help you work with the report, for example, Show Specification (of the report), Open a Report from Clipboard, Copy Report to Clipboard, Manage External Data, options to enable/disable drill up and drill down features, choose to use legacy (Cognos 8) charting engine, and so on. Additional options are covered the “Tools” section, later in the chapter.
9. Help option provides additional help using IBM on the Web, Contents and verifies the version of IBM Cognos Workspace Advanced you use. If you need help with usage of a Cognos Workspace Advanced feature functionality or syntax of a function, use the Contents option from the Help menu.
10. Page Layers. Dropping data item in the Page layers enables you to show each value for that data item in a new page. When you create Page layers, a header with the data item value is created for every page to indicate the contents of the page. You can navigate from one page to another using links in thePage Navigation area. It is an easy and a convenient way to split the report into separate pages for each child of the member that you add to the page layer. This option is available when working with dimensional data.
11. Context Filter. When you drag and drop a data item to the Context filter area, the data in the report gets filtered to show data relevant for the filter values only. This option is available when working with dimensional data.
12. View Members Tree displays the member tree. This option is only visible when working with dimensional data.
13. View Metadata Tree displays the full package tree. This option is only visible when working with dimensional data.
14. Insert Individual Members (currently creating sets). Toggle between creating sets when inserting multidimensional data items and inserting the individual members. This option is only visible when working with dimensional data.
15. Insert Member with Children. Choose this option for multidimensional data items. This option is only visible when working with dimensional data.
16. Manage External Data manages all external data for the current package. This option enables you to work with data from external data files, for example, CSV, TXT, XLS, and XML and combine it with the enterprise content available in the IBM Cognos BI environment.
17. Refresh refreshes the package tree.
18. Source tab contains all the Cognos content you have access to. The Source tab contains data items that belong to the package you choose when you launched Cognos Workspace Advanced. The display can vary depending on the contents of the package, for example, a relationally modeled metadata can appear different than dimensionally modeled metadata. If you have any predefined filters in the currently opened package, you see them in the Source tab. Drag and drop the filter onto to your report to filter the data. For example, if you drag and drop the 2005 filter onto your report, the report will contain only 2005 data.
19. Toolbox tab has tools that you can use to enhance your report. Each option is discussed in detail in the section “Toolbox Tab” later in the chapter.
20. Properties pane. Use this tab to define the property of the currently selected item in your report. The options available to you are context-sensitive. From here you can typically define the Background color, Foreground color, Font, Data format, Border, Padding, Horizontal and Vertical alignment, Data item name, Data item label, and so on. Also, the options available in the Properties pane for an item are guided by the type of report item currently selected, for example, options in the Properties pane for a page header, Page, List, and so on will be different.
Properties Pane
By default, the Properties pane appears minimized on the screen at the bottom of the Source/Toolbox tab. To work with the Properties pane, click the maximize or restore icon. Use the Properties pane to specify properties such as format, color, font, and so on for objects in the report. Options available to you in the Properties pane vary depending on context of the currently select object/data item in the report. The property for a List is different from properties of a column in the List or a Block.
If there are lists, crosstabs, or charts that you want to use in Cognos Workspace, you must give them logical and meaningful names to enable business users using Cognos Workspace to identify them easily. Use the Name property in the Properties pane for the List, Crosstab, or Chart to give it a name that shows in Cognos Workspace.
Notice in the Properties pane the Select Ancestor icon (an upward facing arrow). Use this arrow to select the object for which you want to set the property for. Also, click on different parts of the report, and examine the name change in the Properties pane. The name in the Properties pane specifies the currently selected object in the report. You can switch to a higher level object of the currently selected object/item in the report using the Select Ancestor icon. For example, if the currently selected item is the List, you can easily select the entire Page or Page body (which is a higher-level object than the List) via the Select Ancestor icon. See Figure 9.7 in the next section.
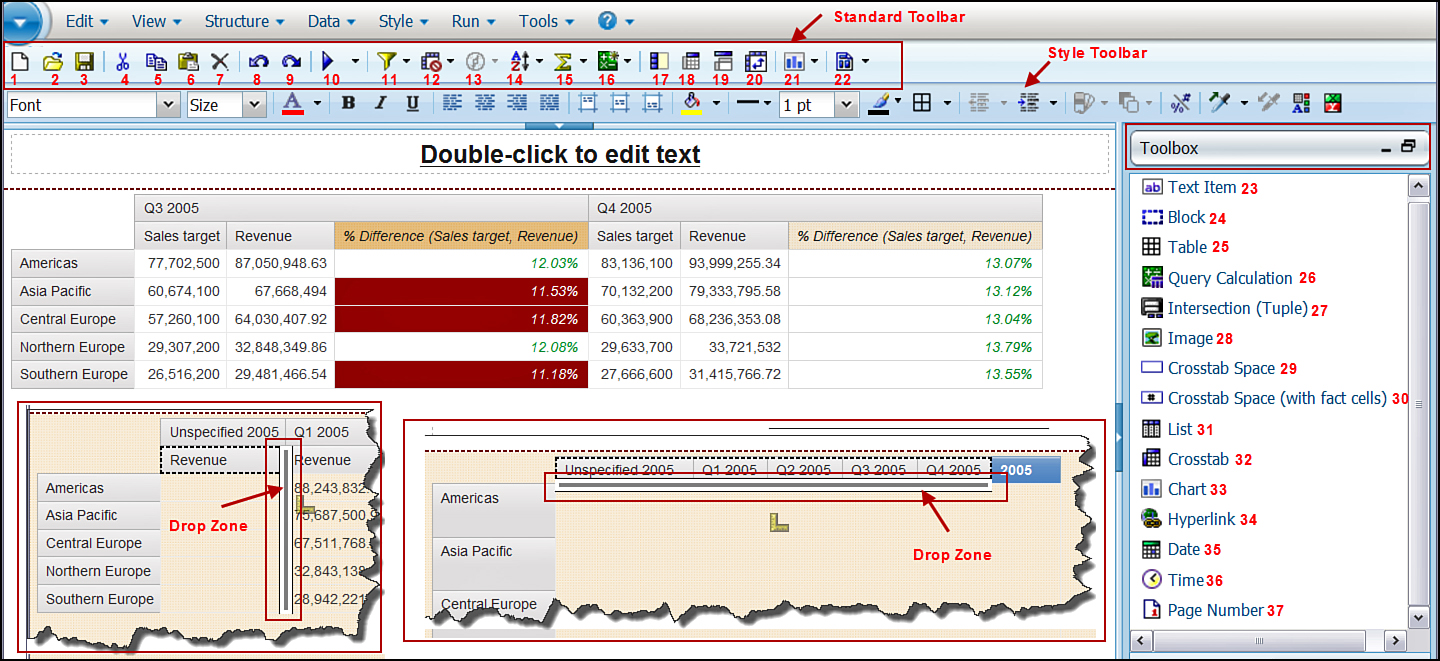
Figure 9.7. Toolbox items, Toolbars, and drop zones in Cognos Workspace Advanced.
Toolbox Tab
The Toolbox tab, as the name suggests, has tools that you can use to enhance your report.
The list that follows describes the Toolbox tab options, numbered 23–37 in Figure 9.7. (Standard toolbar options are described in the section that follows.)
23. Text Item is used to add text to the report. Drag and drop a text item to your report in the location you want to insert the text. You can insert a Text item, for example, Sample Outdoor Company Financial Report, or use it to add multilingual text to the report.
24. Block is an empty container in which you can insert other objects such as Text or an image. It is typically used to add space between objects or control spacing between the object. A block by itself is not rendered until you specify its height and width via the Properties pane. Blocks like other objects have their own properties that enable you to control objects they hold.
25. Table is useful to control where you want the objects to appear in the work area. For example, if you want to display a List of data items, a Chart, a Crosstab, and another Chart in your report, you may consider dropping a 2x2 table onto your work area. You can use each cell in the table to hold each of the four objects: List, Chart, Crosstab, and another Chart.
26. Query Calculation enables you to define your own calculation to use in the report. Drag and drop a Query Calculation onto your report; the Query Calculation window appears enabling you to choose the type of calculation you want to create, for example, Calculated member, Calculated measure, Set expression, and Other expression. If you choose Calculated measure or Set expression, you must choose the Hierarchy for which it is applicable. If you choose Calculated measure, you must choose the Measure Dimension for which the calculation is applicable. When building Query Calculation it is best to use functions available on the functions tab rather than typing it. Always validate the expression to ensure it is correct. The options available are guided by the package, type that is, dimensional or relational package.
27. Intersection (Tuple) is used to insert an intersection (tuple). Drag and drop Intersection (Tuple)from the toolbox onto your report, which brings up the Create Intersection (Tuple) window enabling you to pick from the available list of members and measures from which you can choose the ones you want to add in the Intersection (Tuple). When you choose the Intersection members and measures for the Intersection (Tuple), the appropriate Intersection Hierarchy is automatically populated. This option is available only when working with a dimensional package.
28. Image object is used to add an image to your report, for example, a company logo in the header. When you drag and drop an image from the Toolbox onto your report, you see an image icon. Double-click the image icon to bring up the Image URL window, and browse to the directory to locate the image. The image file (.jpg, for example) must be available on the Cognos server for you to use in the report. If not already available, you should work with your IBM Cognos BI Administrator.
29. Crosstab Space is used to add an empty cell on the crosstab edges. For example, you may want to add space after each Product line in the crosstab to make the report readable. Blank cells appear on the edge where you added the Crosstab Space when the report is run.
30. Crosstab Space (with fact cells) option is useful when you want to add non-data cells on the edge. Unlike Crosstab Space that gets added between the fact cells, this option adds space only to the non-fact cell edge. By default the values that show in the fact cells are the total for the default measure in the Crosstab.
31. List object enables you to drag and drop a List object from the Toolbox when you want to add a list to the currently opened report.
32. Crosstab can be used in the report by dragging and dropping a Crosstab object to your report. You can also insert multiple crosstabs to your report.
33. Chart object enables you to display data graphically in the report. Drag and drop a Chart object from the Toolbox to your report to add a chart. You can add multiple charts to your report.
34. Hyperlink is used to add a hyperlink to your report that users can use to jump to another location, for example, a website.
35. Date object is used to add a date item to the report. Drag and drop a date item from the Toolbox to your report to add a date when the report is run, for example, in the page header or footer.
36. Time is used to display time on the report. Drag and drop a Time item from the Toolbox to your report to display time when the report is run.
37. Page Number is used to add page numbering to the report. Drag and drop a Page Number item from the Toolbox onto your report to add a page number. Double-click the Page Number icon to open the Number Style window. From here, you can select one of the available numbering styles or click the pencil to open the Custom Number Style to define your own numbering style.
Standard Toolbar Options
The Standard Toolbar has icons for frequently performed actions. Most of these actions can also be performed via options on the Application bar, for example, Edit, View, Structure, Data menu, and so on. These options are briefly explained here and are shown in Figure 9.7 and listed in the same sequence they are displayed in the figure.
1. New enables you to create a new report in Cognos Workspace Advanced.
2. Open enables you to open an existing report and work with it.
3. Save is used to save the changes made to the currently opened report.
4. Cut enables you to cut an item from the report and put it on the clipboard.
5. Copy enables you to copy an item in the report and put it on the clipboard.
6. Paste enables you to paste the copied/cut item from the clipboard onto the report.
7. Delete enables you to delete a report item/object from the report.
8. Undo enables you to undo recent changes. You can undo multiple changes.
9. Redo enables you to redo an undone change. You can redo multiple changes.
10. Run Report enables you to run the currently opened report. You can choose from one of the following depending upon the report output format required. Options available are Run Report –HTML (default); Run Report – PDF; Run Report – Excel 2007; Run Report – Excel 2002; Run Report – Delimited Text (CSV); Run Report – XML; and specify Run Options.... Use Run Options... to specify the report Format; Paper size; Paper Orientation; Data mode (All Data, Limited Data, and No Data); Language; Rows per page; enable/disable Prompt; and enable/disable Include accessibility features.
11. Filters enables you to define the filter on the currently selected item in the report. The options available are context-sensitive. For example, the options available on numeric columns and string columns will be different. Also the options available when you select a single numeric column or multiple numeric columns will be different. Filters are discussed later in the section “Filtering Data.”
12. Suppress enables you to suppress empty rows and columns in the report and enhance report readability, which is discussed in detail in the section “Suppressing Empty Cells in a Report.”
13. Explore is enabled only when working with dimensional data source. It enables you to drill down or drill up to view lower or higher levels of data. It provides additional options that enable you to explore your dimensional data easily and quickly, for example, Top or Bottom, Exclude members, and so on. Explore is shown as 13 in Figure 9.7. Explore is discussed in detail later in the section “Explore.”
14. Sort enables you to define sorting rules for the currently selected item in the report. You can specify Sort by Label or Sort by Value and specify how you want to sort the data, for example, by caption, property, or intersection (tuple). This is discussed in further detail later in the section “Sorting Report Data.” Sort is context-sensitive, and the options available will be guided by the data item currently selected.
15. Summarize enables you to summarize the currently selected data. Summary options available here are Total, Count, Average, Minimum, and Maximum. Summarize works on numeric values only.
16. Insert Calculation enables you to insert a calculation for the currently selected item in the report. Options available vary depending on context. Insert Calculation is discussed in detail later in the section “Creating Calculations.”
17. Group/Ungroup enables you to group or ungroup selected data in a List report. Grouping data in a List report removes duplicates from the report. Group/Ungroup is discussed in detail later in the section “Group/Ungroup Data in the Report.”
18. Pivot List to Crosstab enables you change a List into a Crosstab report. The selected list column becomes the column in the Crosstab report, and other list columns become crosstab rows. This option is discussed in detail later in the section “Using the Pivot List to Crosstab Option.”
19. Section/Unsection enables you to create sections in the report to show the item used for sections as a header and is displayed outside of the list, crosstab, chart, or repeater. This option is discussed in detail later in the section “Creating Sections.”
20. Swap Rows and Columns enables you to swap the rows and columns in a Crosstab report. In a Chart report, the x-axis and y-axis values are swapped.
21. Insert Chart option enables you to insert a Chart in the currently opened report. You can choose the chart type from the drop-down list and select the More... option. This option is discussed in detail later in the section “Inserting a Chart in Your Report.” When you use the Insert Chart option to add the chart to your report, the chart is prepopulated using the data from the List or Crosstab currently selected in the report.
22. Page Layout enables you to choose from a predefined page layout for the currently opened report. This option is discussed in detail later in the section, “Using the Page Layout Option.”
CREATING A NEW REPORT
To create a new report in Cognos Workspace Advanced, you must first choose the package that contains your reporting information, that is, metadata. Reports you create in Cognos Workspace Advanced can be reused in Cognos Workspace. If you intend to use the report in Cognos Workspace for building dashboards, remember to give a meaningful name to the report/report parts (List, Chart, and so on).
After you choose the package to work with, choose the Create new button and select the report layout for the report, for example, List, as shown in Figure 9.8.
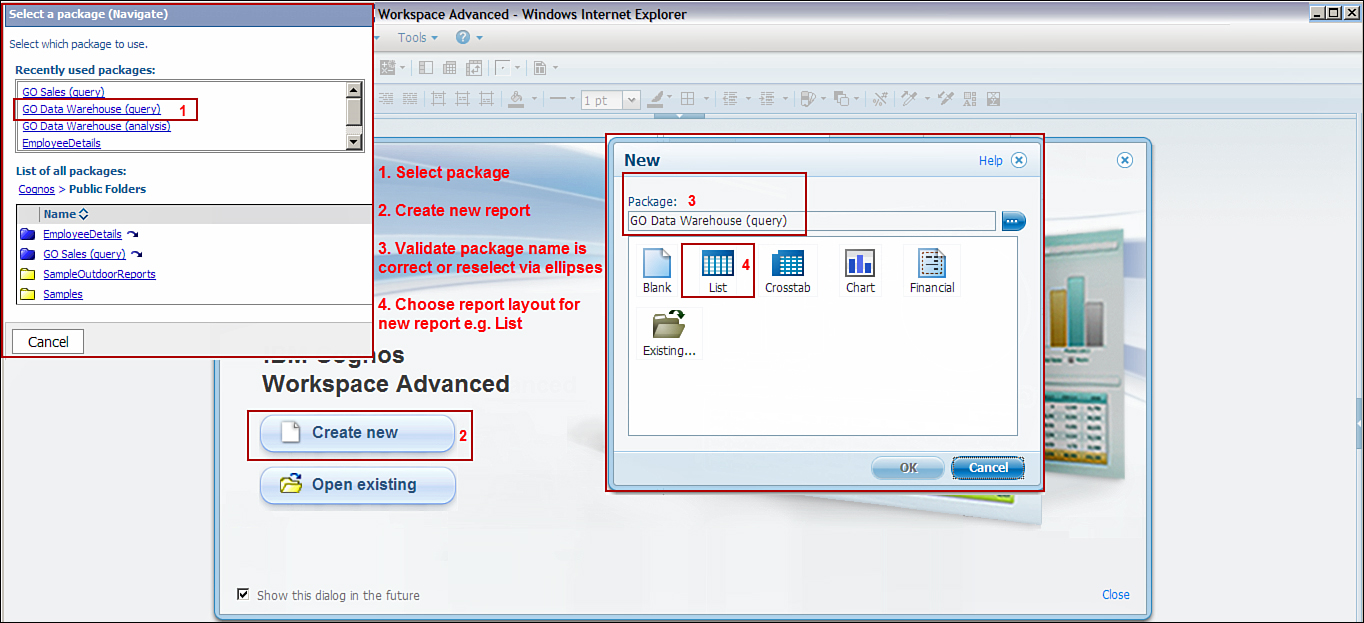
Figure 9.8. Steps to create a new report.
WORKING WITH RELATIONAL STYLE REPORTS
This section discusses various report building options available when working with relational reports. As you work through this section, notice the various objects available in relational model, and you see that these objects are different from what is available to you when building dimensional reports (discussed later in the section, “Creating a Dimensional Report.”) Although several options are available in both relational and dimensional reports, a few of them differ. Overlapping sections are discussed only once in the “Working Relational Style Reports” section.
Steps to Create a New Report
Figure 9.9 illustrates how to create a report. The step numering shown in the figure is independent of that in the list that follows.
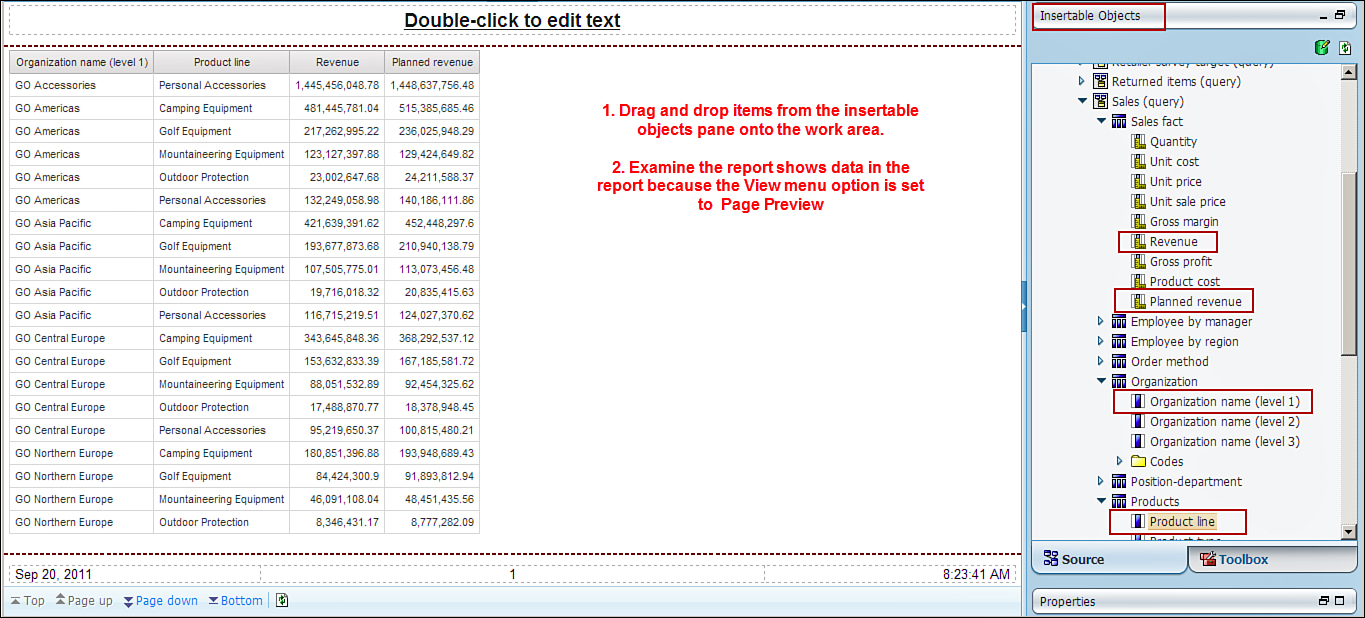
Figure 9.9. Add items from the Insertable Objects pane to build a report.
To create a new report, perform the following steps:
1. In Cognos Connection, click Launch > Cognos Workspace Advanced.
2. In the Select a Package window, choose Public Folders > Great Outdoors Samples > Samples > Models > Go Data Warehouse (query).
3. From the Cognos Workspace Advanced Welcome page, choose Create New.
4. Ensure that the package name is correct.
5. Select List for the report layout of the new report.
6. From the Source tab on the right of the screen, navigate to Sales and Marketing (query) folder > Sales (query) namespace > Sales fact query subject > double-click query item Revenue to add it to the report.
7. Double-click Planned Revenue to add to the report.
8. Navigate to Organization query subject in the Sales (query) namespace > double-click theOrganization name (level 1) query item to add it to the report.
9. Click the Organization name (level 1) column, and drag and drop it as the leftmost column in the report.
NOTE: You should release the mouse button when you see three blinking lines indicating the drop zone.
10. Expand the Products query subject and drag and drop Product line between the Organization name (level 1) and Revenue columns in the report.
Examine that the Organization Name (level 1) and Product line values are repeated. You can remove the duplicates by grouping the data; you can group the data later.
11. Save the report as MyFirstBusinessInsightReport.
Modifying Item Properties
You can modify the item properties to enhance your report, some of the features are shown in Figure 9.10. Open the report MyFirstBusinessInsightReport, and use it to build upon with the steps that follow.
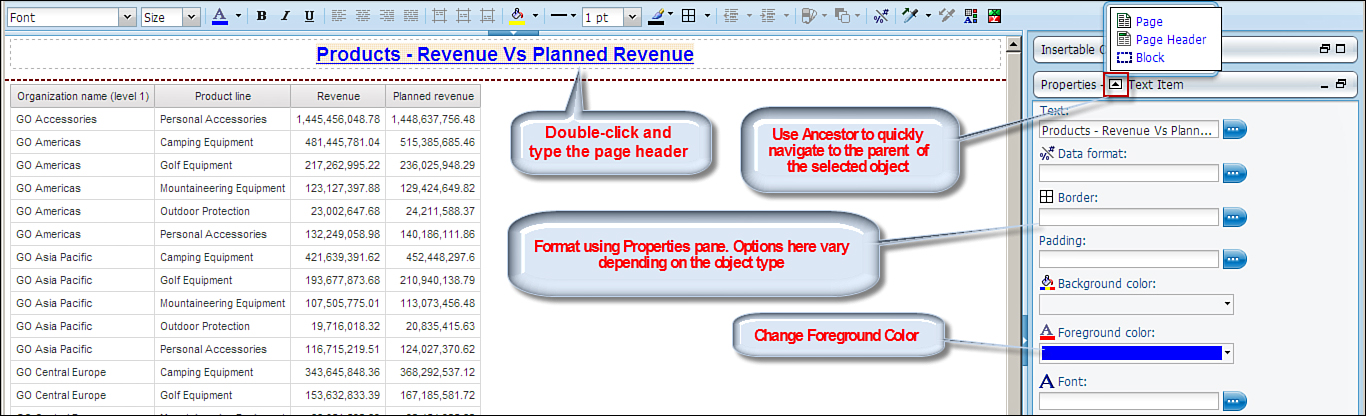
Figure 9.10. Modify properties of an item or object in the report.
1. Double-click the page header (double-click to edit text) to add a title to the report, and typeProducts – Revenue Vs Planned Revenue.
2. In the Properties pane for the text item for page header, click the Foreground Color and change it to Blue (or a color of your choice).
NOTE: Examine the options available to you in the Properties pane. You’ll see in the upcoming steps that the options available in the Properties pane are guided by the type of data item/object it is, for example, List, Page, Block, and so on.
3. To change the column title of the column, click the Column header Organization Name (level 1).
4. On the bottom right of the screen, in the Properties pane, click the Maximize icon, which brings up the properties of the Data item Organization name (level 1).
NOTE: Examine the Properties tab, which displays List Column Title indicating that you are working with the properties of that item. Examine the other options available to you in the Properties pane, for example, Data format, Border, Padding, Background color, Foreground color, Font,Horizontal alignment, Vertical alignment, White Space, Data item name, and Data item label.
5. Click the Data item label: at the bottom of the Properties pane.
6. In the Data Item Label window, type Organization, and click OK.
Examine the column header, which now appears as Organization instead of Organization name (level 1), which is not meaningful in a report.
Examine the repeated values in the Organization name (level 1).
7. Save the report.
Group/Ungroup Data in the Report
Use the MyFirstBusinessInsightReport report from the previous section to build upon; use the following steps:
1. Click the column Organization.
2. Click the Group/Ungroup icon on the Standard toolbar.
3. Save the report- report name MyFirst Business Insight Report.
Examine the repeated Organization values that have been removed, for example, GO Americas appears only once for a repeated Product line, as shown in Figure 9.11.
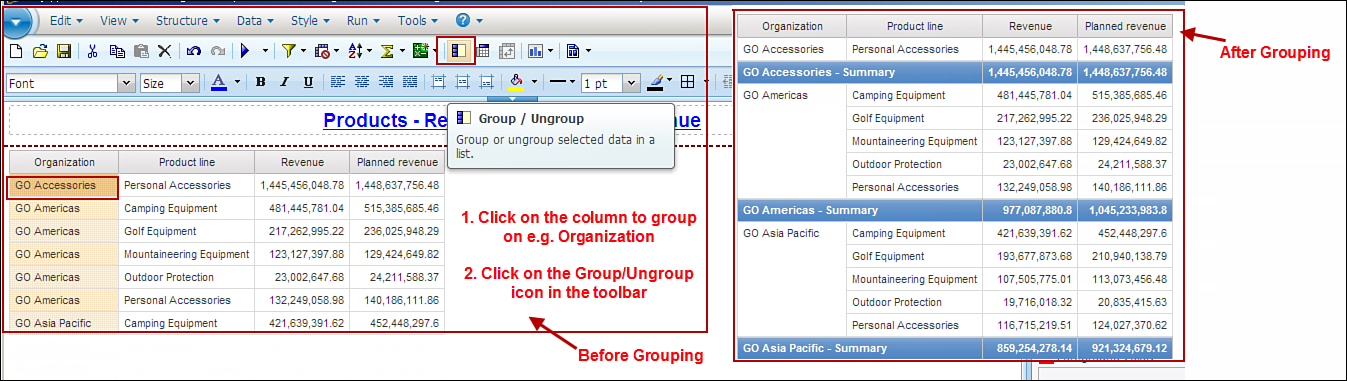
Figure 9.11. Remove duplicates from a report by grouping the data.
To ungroup the data in the report, click the grouped column (Organization), and click theGroup/Ungroup icon.
Displaying Summary in a Grouped Report
You can automatically display the summaries in a grouped List report by enabling the featureAutomatic group and summary behavior for lists option. This provides the report user the flexibility to enable/disable summaries as required.
1. Enable automatic summary by clicking Tools menu> Options > Report tab > select the Automatic group and summary behavior for lists check box > click OK, as shown in Figure 9.12.

Figure 9.12. Enable/disable Automatic group and summary behavior in list report.
2. Click Organization column > click Group/Ungroup on the Toolbar.
NOTE: You can click the summary row and delete it via the delete icon on the toolbar if you do not need the summary in the report.
The summary for each grouped column is now added to the report by default.
Creating Custom Groups
Custom groups enable you to categorize data into business or functional groups that enhance your reports. For example, you can create groups that put employees with last name A–D in one group, E–H in another group, and so on by creating a custom group on the last name.
You can create custom groups on both List and Crosstab reports. When you create custom groups in a List report, a new column is added to the report with a default name of data item (Custom); however, you can change this and provide one that is meaningful to you. You can keep the original columns and the new column or delete the original column and display only the new custom column in the report.
You can create custom groups for List as well as Crosstab reports. The steps are similar; the only difference is that in case of a List report, a new column is added for the custom group you create. You may delete the original column if not required in the report, as shown in Figure 9.13.
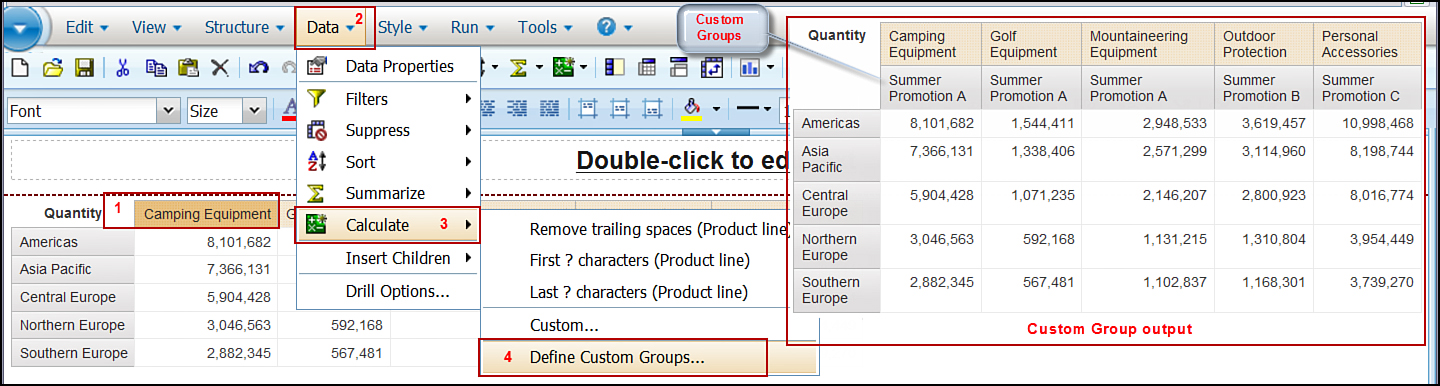
Figure 9.13. Group data logically to reflect business needs by creating custom groups.
In both the cases you have three choices on how you want to create the groups:
• Do not show remaining values: This option enables you to create the groups and assign values you require. The values that you do not assign to a custom group appear without a column header in the report when the custom group is created. You may keep or delete them depending on your reporting need.
• Use each remaining values as a group name: This option enables you to put certain values in a group and leave the remaining as is. For example you can create only one group called Summer Promotion with Camping Equipment and Golf Equipment. The rest of the values appear in the report as is, for example, Mountaineering Equipment, Outdoor Protection, and Personal Accessories.
• Group remaining values into a single group: This option enables you to create a custom group and assign it values. Those values that do not get assigned to the custom group can all be displayed together under one header, for example, Other; however you may type a meaningful name to be displayed.
The New data item name option enables you to provide a name for the new column that is created in a List report when you create a custom group. By default it is data item name (Custom); however, you may provide a meaningful name if required.
Steps to Create Custom Groups
If not already open, open the MyFirstBusinessInsightReport to build upon using the following steps:
1. Click the column you want to create a custom group on, for example, Camping Equipment, in the Crosstab report (refer to Figure 9.13).
2. Click the Data menu > Calculate > Define Custom Groups....
3. From the Define Custom Groups window (as shown in Figure 9.14), click the New Select Values Group....

Figure 9.14. Steps to create custom groups and the output.
NOTE: You can also choose to define a New Range Group... rather than New Select Values Group.... Using the New Range Group enables you to define a range as Lowest or Highest or define To Fromvalues for the range.
4. In the Define Custom Values Group window, type a name in the New group name box, for example,Summer Promotion A.
5. Ctrl+Click Camping Equipment and Golf Equipment > click the right green arrow to move your selection to the Selected values box > click OK.
6. Repeat steps 3–5 and create another custom group Summer Promotion B with valuesMountaineering Equipment and Outdoor Protection.
7. Repeat steps 3–5 and create a third one Summer Promotion C with the remaining value, that is,Personal Accessories.
NOTE: You have three groups created: Summer Promotion A, Summer Promotion B, and Summer Promotion C.
8. Click OK.
Ensure the result has two column headers: the original header, Product line, and the new Custom group name as Product line (custom) for the custom groups you created. You may delete the original Product line column if you do not want to display them in the report.
9. Save the report.
Creating Sections
Sections enable you to divide the report by the column you specify to section on. You can create sections in a List, Crosstab, or Chart report.
When you section a report on a data item, the section column becomes the section header outside of the List, Crosstab, or Chart. A key point to note is that although sections are similar to grouping the data in the report via the Group option, the Group/Ungroup is only applicable to a List report. Deleting the section returns the data back to the original, that is, a List, Crosstab, or Chart. If you created a section in a Crosstab using both rows and columns, removing the section returns all the data to the edge of the Crosstab; however, you can move it to where you want in the report.
Figure 9.15 shows the steps to create a section in the report, as described in the list that follows:
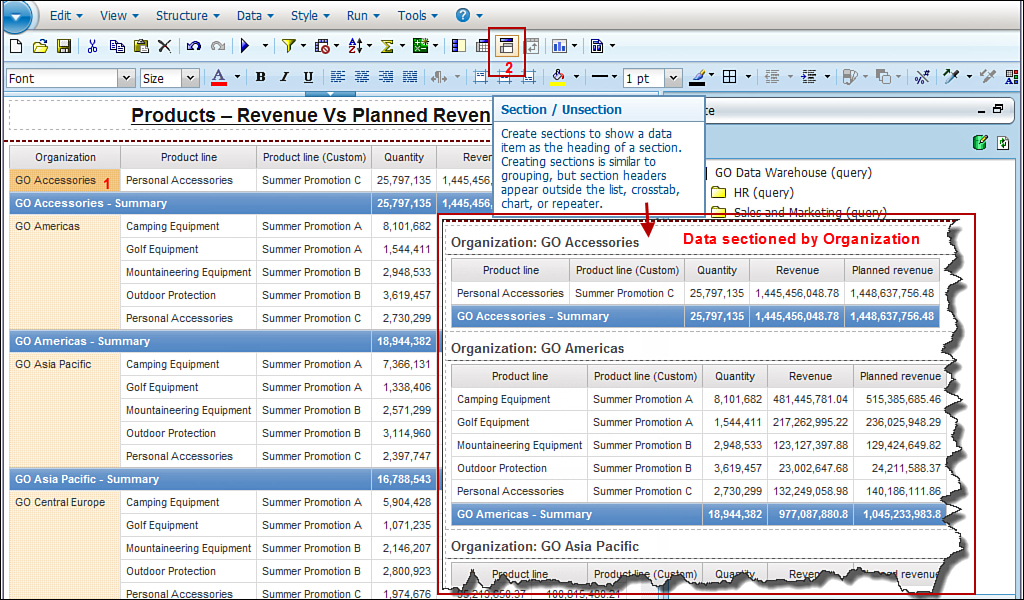
Figure 9.15. Section the report by Organization.
Note
If you have not followed the prior steps and are starting afresh, create a new List report and drag and drop Organization, Product Line, and Quantity to build the report and follow along.
1. Open the MyFirstBusinessInsightReport report.
2. Click the column to section on, for example, Organization.
3. Click the Section icon on the Standard toolbar.
NOTE: The Sectioned column now appears as the section header outside of the list.
Alternatively, you can Section/Unsection using the Structure menu > Section/Unsection, from the Application bar menu.
You can Unsection data in the report by clicking the section column. Unsection removes the sectioning and returns the sectioned column, for example, Organization to the list.
4. Click the Organization column, for example, GO Americas (refer to Figure 9.15) and clickUnsection.
Creating Calculations
In addition to working with the content from the package, you can create calculations to enhance your report. If you have standard calculations used by various other reports and users, you may request the IBM Cognos Metadata Modeler to provide them in the package.
Figure 9.16 demonstrates how you can create calculations in your report using the Insert Calculationicon from the Standard toolbar. The options available to you on the Insert Calculation menu vary depending on the context. For example, if you have a single column selected, you have options that relate to a single column, for example, Absolute; Round; Round up; Round down; % of total for selected column; and Custom.... In Figure 9.16, Option1 on the right demonstrates a single-column scenario.
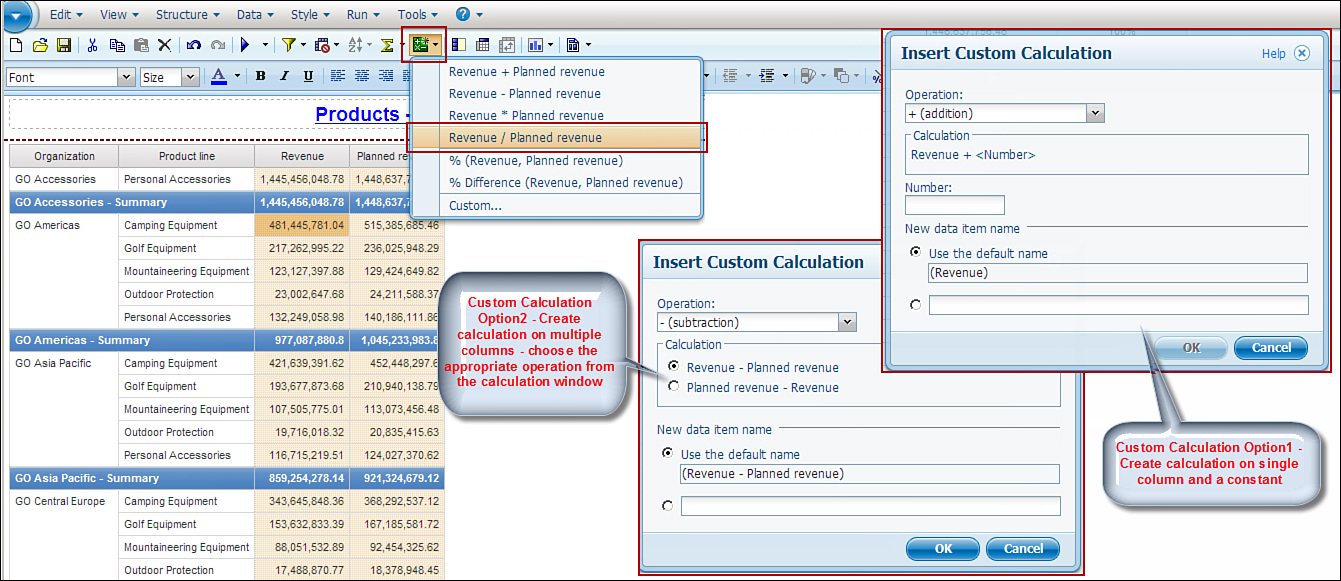
Figure 9.16. Create custom calculations in the report.
When you have more than one column highlighted, for example, Revenue and Planned Revenue, the options available to you in the Insert Calculation menu are based on the two selected columns. Option 2 for Insert Custom Calculation window demonstrates options available to you in this scenario.
Calculation Solve Order
The result of the calculation may vary depending on the solve order used in the calculation. In reports where calculations in the rows and columns intersect, the calculation will be performed in the following order:
1. Addition or Subtraction
2. Multiplication or Division
3. Aggregation (rollup)
4. Other arithmetic functions, for example, absolute, round, round down, average, minimum, maximum, medium, and count
5. Percentage, % difference (growth), or % of total
6. Rank, quartile, quantile, or percentile
When both calculations have the same precedence, row calculation takes precedence. If you want to override this precedence, you can do this by opening the report in Report Studio via the Solve orderproperty.
It is recommended when creating calculations that you use the functions and expressions available in the Expression window in Cognos Workspace Advanced, instead of typing them yourself.
Steps to Create Calculation
To create a calculation in your report, perform the following steps:
1. Open the MyFirstBusinessInsightReport report.
2. Ctrl+Click Revenue and Planned Revenue columns; then click the Calculate icon on the Standard toolbar.
3. From the drop-down list, choose Revenue/Planned Revenue.
NOTE: An additional column is added to the right. You can format this column in the next section (not shown).
4. Undo the change because you can manually create this calculation later in this section.
Creating Custom Calculations Using Query Calculation from Toolbox
You can create custom calculations to define complex formulas. Custom calculation is also commonly used to create calculations using columns not displayed in the report.
Use the Query Calculation option available to you in the Toolbox tab to build the required calculation. The calculation could be an arithmetic calculation, date calculation that enables you to add or subtract days from a date value, or a string calculation like extracting certain values from a string value to display in the report.
The Data Item Expression window has the Available Components section, which enables you to use the data items from the package to build the calculation. As shown in Figure 9.17, the Available Components pane has three tabs:
• Source tab (left) displays all the Cognos content you can use from the package to build the calculation.
• Data Items tab (center) displays all the data items currently in the report and those not displayed in the report, but you added them to the query.
• Functions tab (right) displays all the operators; summaries for List, Crosstab and Chart reports; functions like abs, cast, extract, floor, and so on.
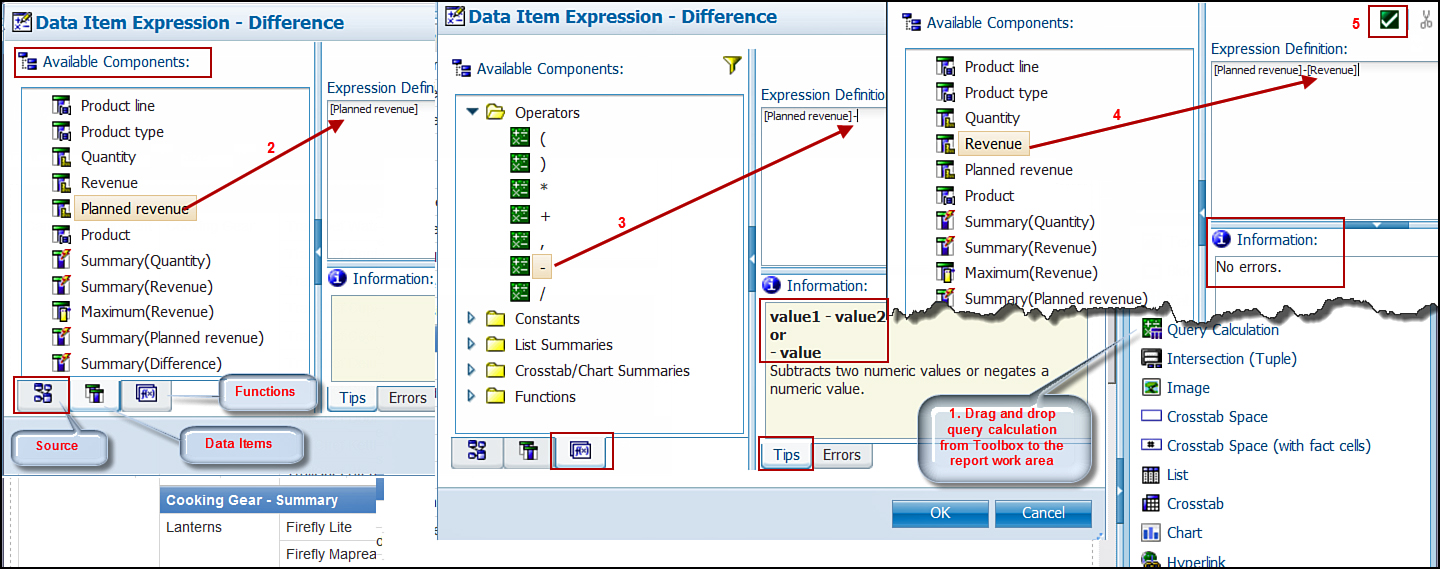
Figure 9.17. Create an expression using components from the Functions tab.
On the right side of the Data Item Expression window is the Expression Definition section, where you can build the calculation by dragging and dropping functions/operators/summaries and data items from the Source and/or Data Items tab. On the top right of the Expression Definition section, you have tools to validate the expression you built for any errors and tools like cut, copy, paste, and delete.
Below the Expression Definition section is the Information section. The Information section has two tabs:
• Tips: Displays the syntax of the function, summaries, and so on that you may want to use from the Available Components section (right). The syntax for the currently selected item, such as minus (–) in the Available Components pane displays here on the Tips tab.
• Errors: Displays the result of Validation. After you build the expression for calculation, it is recommended that you use the Validate button (top right of the screen, tick mark) to ensure that the expression is error-free. If no errors are encountered, No Errors displays in the Information section; however, if errors were encountered, the error displays here.
To create a custom calculation using Query Calculation from the Toolbox, perform the following steps:
1. Open the MyFirstBusinessInsightReport report.
2. Navigate to the Toolbox tab, and on the Insertable Objects pane, drag and drop Query Calculation as the last column in the List, as shown in Figure 9.17.
3. In the Create Calculation window, type RevenueDifference > click OK.
4. In the Data Item Expression window, Available Components section > Data Items tab > drag and drop Planned Revenue to the Expression Definition section. (Alternatively, double-click Planned Revenue to add it to the Expression Definition section.)
5. Navigate to the Functions tab in the Available Components section, expand the operators folder, and double-click the minus sign to add it to the Expression Definition section.
6. Navigate to the Data Items tab; double-click Revenue to add it to the Expression Definitionsection.
7. Click the Validate button (top right, tick mark in the Expression Definition section).
NOTE: Ensure that the Information section displays No Errors after validation; if there are errors you must work through until it is error-free.
8. Click OK.
9. Save the report.
Formatting Report Data Using the Properties Pane
By default, the calculation is the column header, which you can change via the Properties of the item, as shown in this section. You can also modify an existing calculation, as shown in Figure 9.18 and described in the list that follows.
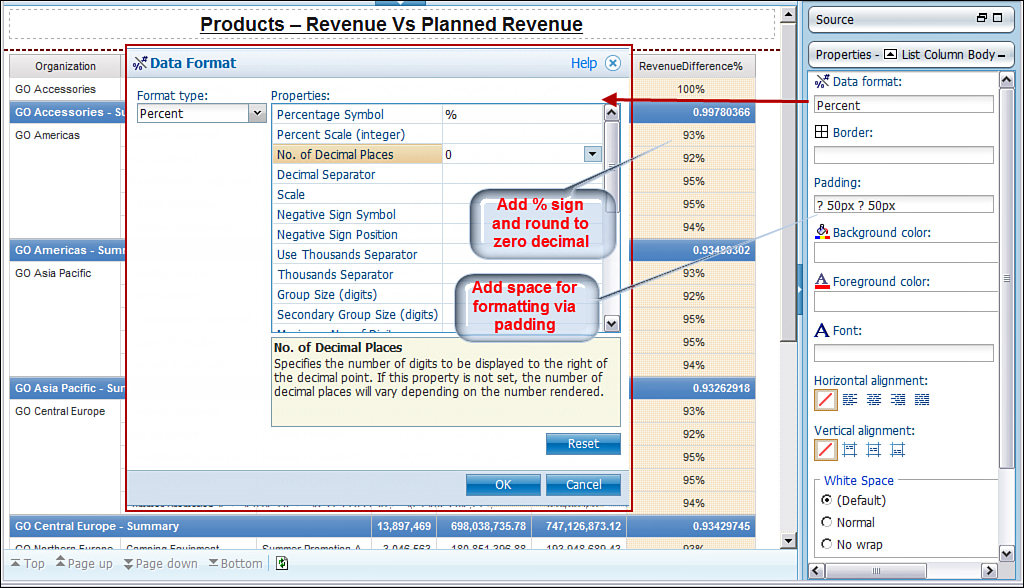
Figure 9.18. Format items in the report using options in the Properties pane.
To format data in the report, perform the following steps:
1. Open the MyFirstBusinessInsightReport report.
2. Double-click the column header of the newly created calculated column Planned Revenue-Revenue, RevenueDifference.
3. Delete the existing expression > from the Data Items tab drag and drop Revenue > at the end of the expression type / > from the Data Items tab drag and drop Planned Revenue > Validate >OK.
NOTE: You have modified an existing calculation to reflect the new business rule required in the report.
4. Format the newly created calculated column, click the RevenueDifference column body > click on the Properties pane > Maximize.
5. Now change the column title to RevenueDifference%. Locate Data item label > click ellipses> in the Data Item Label box, type RevenueDifference% > click OK.
6. In the Properties pane, click Data format; in the Data Format window for Format type, selectPercent.
7. In the Data Format window, Properties for Percentage Symbol, choose % and for No. of Decimal Places, choose 0.
NOTE: If you choose the fifth option from the calculate menu (refer to Figure 9.16) the result would be the same, and you would not have to format the result for the percentage symbol. However, you still must format the decimal places to 0. The steps here demonstrate how to use the options in theProperties pane.
8. In the Data Format window, scroll down the Properties section and for Missing Value Characters, type Missing Data.
9. Navigate to the property Zero Value Characters in the Data Format window > type NA.
10. Click OK.
NOTE: Click the Reset button if you want to refresh the Properties and start over again.
11. Click the Padding option, and type 50 for both left and right padding. Then proceed with other defaults. Click OK.
NOTE: This enables you to make your report easier to read. You can add spaces between the values by padding them with space using the Padding option in the Properties pane.
12. Delete the Summary row by clicking the summary row and clicking the Delete icon on the Standard toolbar or delete.
13. Click any column in the report.
14. In the Properties pane, click the Select Ancestor button, choose List.
15. In the Name option, type Revenue Vs Planned Revenue.
16. Save the report.
Style
Use the Style option to change the appearance of objects in the report. You can define or modify styles from the Style option on the Application menu or from the Style toolbar. For example, if you have defined a style on an object, click that item and select it; then click the pick up style button. Then click the item you want to apply the style to, and click the apply style button on the Style toolbar to apply it to the item. You can use one of the following Style options:
• Style...: Use this option to specify the appearance of the selected object in the report. Style has Basicand Advanced tabs:
• The Basic tab provides options to define the Background color; Foreground color; Horizontal alignment (default, Left, Center, Right, and Justify); Vertical alignment (Default, Top, Middle, and Bottom); Font (Family, Size, Weight, Style, Underline, Overline, Line-Through, and Foreground color);Border (Style, Width, Color, Apply All Borders, Remove All Borders, Apply Top Border, Apply Left Border, Apply Bottom Border, and Apply Right Border); Padding (left, right, bottom, and top); andData Format (Format type – Default, Text, Number, Currency, Percent, Date, Time, Date/Time, Time Interval, Custom, and associated properties).
• The Advanced tab provides options to add a Background image (URL, Position, and Tiling);Background effects (Border, Fill, Drop Shadow, and Images); Size & Overflow (Height, Width, Overflow – Content is not clipped, Content is clipped, Use scrollbars only when necessary, and Always use scrollbars); Spacing & breaking (Spacing – Line height, Letter spacing, Text indent, Breaking – Word break, for example, Break words when necessary, Enforce stricter line-breaking rules for Japanese text); Text flow & Justification (Text flow – Direction, for example, Default, Inherit, Left to right or Right to left, Writing mode – Default, Left to right top to bottom, Top to bottom, Right to left, Bi-directional – Default, Normal, Embed, Override); and Justification – Type (Default, Distribute all line, Inter cluster, Inter ideograph, Inter word, Kashida, and Newspaper), Kashida space(%), White Space (Default, Normal, No wrap), and Classes.
• Conditional Styles...: Use this to apply conditional styles and highlight exceptional business conditions. For example, you might want to color those products that have exceeded the sales target as green, whereas those that have not met the target and need following up as red.
• Apply Table Style...: Use this option to apply a predefined table style to tables. You can use this option to quickly format crosstabs and tables. You must first click the object, for example, a table, list, or crosstab; then choose the table style you want to work with from the Table Styles option.
Applying a Conditional Style to Highlight Exception Data in the Report
Conditional Styles enable you to highlight data in the report to make it easily readable. Figure 9.19shows the steps you need to follow to apply conditional highlighting to the data in the report.
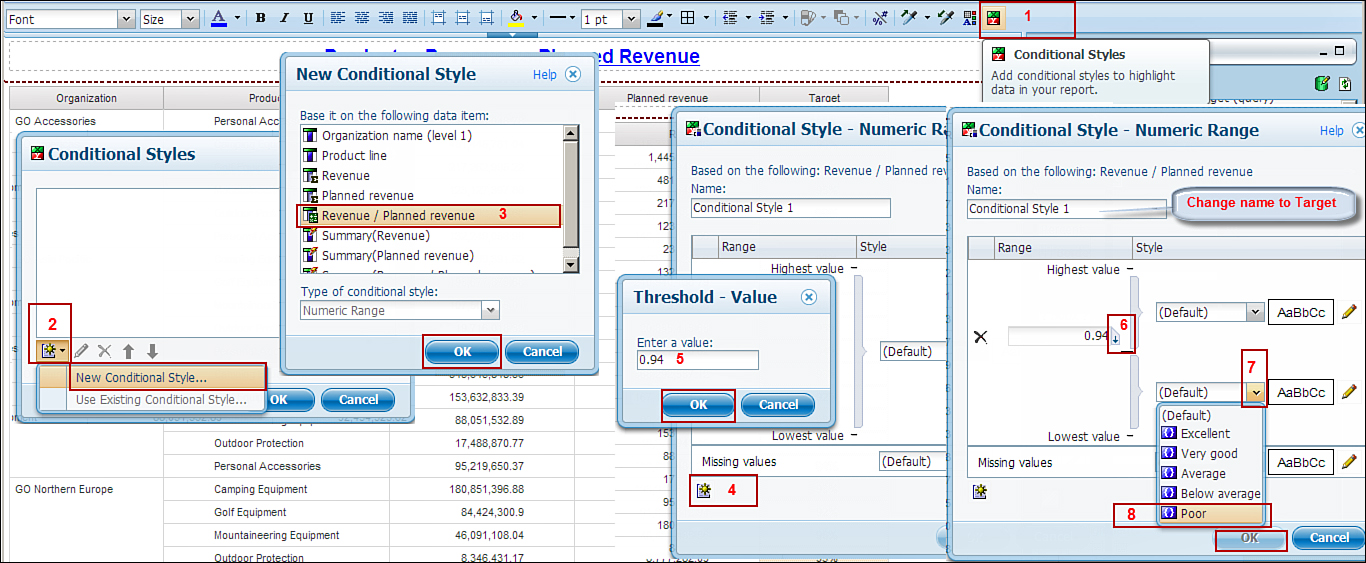
Figure 9.19. Steps to create conditional styles.
To create a conditional style, perform the following steps:
1. Open the MyFirstBusinessInsightReport report.
2. Click the newly created calculated column, RevenueDifference%.
3. Click the Style menu > select Conditional Styles icon in the Style toolbar (refer to Figure 9.19).
4. Click the New value icon (looks like a bicycle gear) and choose the New Conditional Style...option.
5. Choose Revenue/Planned Revenue RevenueDifference from the New Conditional Stylewindow, and click OK.
6. In the Conditional Style window, Name box > type RevenueDifference%.
7. Click the New Value icon (looks like a bicycle gear) to define thresholds.
8. In the Threshold – Value window, type .94 and then click OK.
9. Click the up arrow on right side of the value you entered (shown as step 6 in Figure 9.19), which changes the arrow pointing downward, indicating that the rule applies to all values below the typed in value, for example, .94.
10. Click the Style drop-down for Lowest value > select Poor.
NOTE: By default Poor is defined by a red color. You can modify the foreground and background color using the Edit Style (pencil) icon. In addition, you can also specify style for the Highest value and missing values using the drop-down list.
11. Click OK and OK again.
12. Save the report.
Figure 9.20 shows the final results of applying the conditional style. Ensure that all rows where the Target column value is less than 94% are colored RED highlighting if that target is not met.
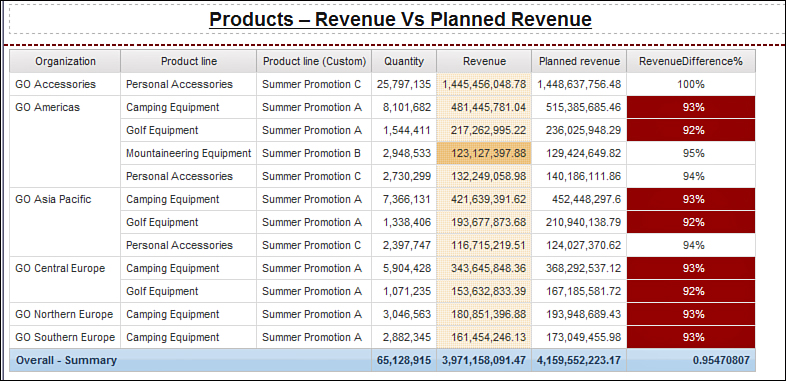
Figure 9.20. Report output with conditional style applied.
Filtering Data
Filters enable you to remove unwanted data from the report. When you apply a filter on your report, only the data that meets the filter criteria is retrieved from the underlying database. When working with relational data, the filter options available to you vary by context, for example, options available to you when you select a single column, multiple columns, string value column, numeric column, and so on. You can also choose to include or exclude the null values in the report via the check box optionInclude missing values (NULL). You can apply more than one filter in your report to filter data.
For each filter you create, you have an option to specify them as Required (mandatory), Optional, orDisable (do not use, however—keep it around to use later). In addition, you can specify if the filter is to be applied on detail or aggregated values via the option Before auto aggregation and After auto aggregation. The Before auto aggregation option applies the filter on detail (individual) rows and uses only those rows for aggregation that meet the filter criteria. On the other hand, the After auto aggregation option applies a filter on the summarized value.
Filter Include/Exclude
Include and Exclude filter options are used to filter data in the report. You can use Include or Excludeto keep or remove one or more rows from the report. You can easily include or exclude data from the report by first selecting the row(s) and then use the Include/Exclude option from the Filters option in the Data menu. You can also include or exclude Null values from the report using the Include/Exclude option.
1. Open MyFirstBusinessInsightReport report.
2. Ctrl+Click on the rows you want to exclude, for example, GO Accessories, GO Asia Pacific, GO Central Europe, GO Northern Europe, and GO Southern Europe.
3. Click Data menu > Filters > choose Exclude > GO Accessories, GO Asia Pacific, GO Central Europe, GO Northern Europe, GO Southern Europe.
NOTE: The report now displays GO Americas only. All the others (GO Accessories, Go Asia Pacific, GO Central Europe, GO Northern Europe, GO Southern Europe) were excluded from the report, as shown in Figure 9.21.
4. Save the report.
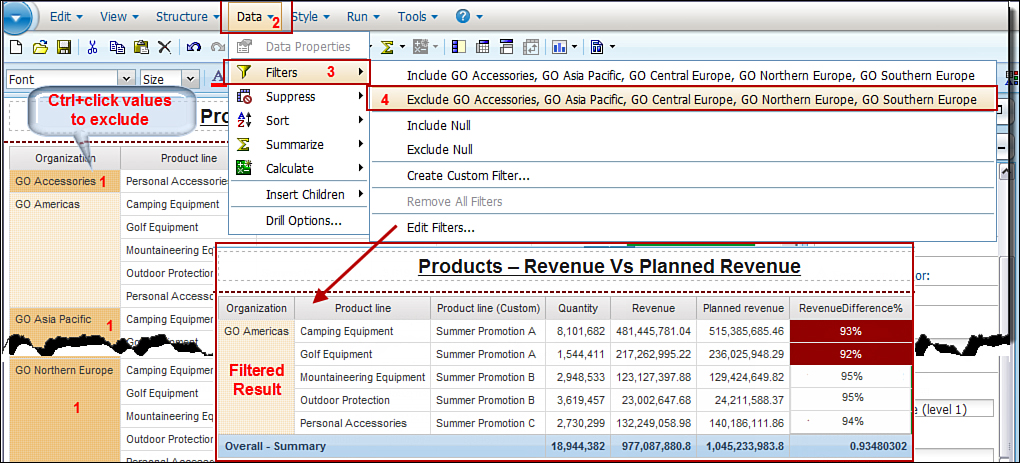
Figure 9.21. Apply filter in the report using the Exclude option.
Editing Filters
You can modify an existing filter using the Edit Filter option, as shown in Figure 9.22 and described in the list that follows.
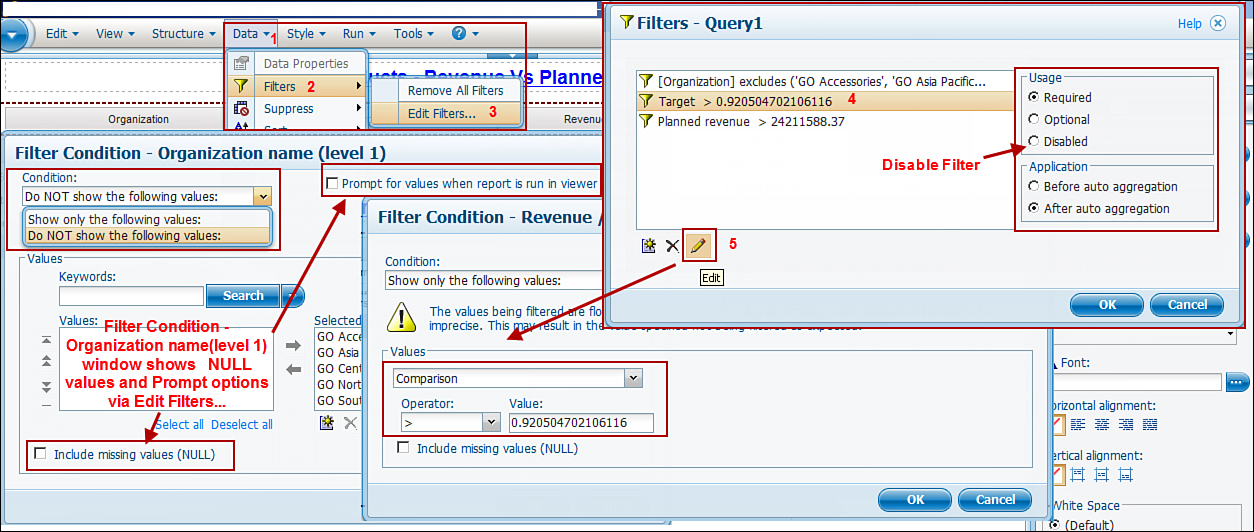
Figure 9.22. Steps to edit existing filters in the report.
1. Open the MyFirstBusinessInsightReport report.
2. Click the Data menu on the Application bar.
3. Select Filters > Edit Filters....
4. In the Filters window click the filter you want to edit, for example, [Organization] excludes (GO Accessories, GO Asia Pacific, GO Central Europe, GO Northern Europe, and GO Southern Europe).
6. From the Filter Condition window, you can modify the filter condition, Include Missing NULL valuevia the check box, Prompt for values when the report is run via the check box, and conditions to show or not show via the Condition drop-down, for example, Show only the following values, Do NOT show the following values.
NOTE: The options available to you in the Filter Condition window for the Organization name (Level 1) and Revenue/Planned Revenue filter condition window will be different. Options available to you are guided by the type of data used to build the filter, for example, numeric, character, and so on.
7. Save the report.
Disabling a Filter
You can remove the filter condition from the report without deleting the filter from the report by using the disable option. Disabling a filter enables you to temporarily remove the filter from the report. In the future, to use the filter again you can choose Required or Optional to meet your reporting requirement.
To disable a filter, perform the following steps:
1. Open the MyFirstBusinessInsightReport report.
2. Click the Data option on the Application bar.
3. Choose Filters > Edit Filters....
4. In the Filters window, select the filter by clicking it, for example, [Organization] excludes (GO Accessories, GO Asia Pacific, GO Central Europe, GO Northern Europe, and GO Southern Europe).
6. Click OK.
7. Save the report.
To enable the filter when you want to apply it again, in the Filters window, Usage section you can choose the Required option for mandatory filters.
Removing All Filters
Use the Remove All Filters option to remove all the filters from the report. If you mistakenly removed All Filters, use the Undo option on the Standard toolbar to undo the previous action of removing all filters. If you want to temporarily remove a specific filter from the report, you can disable the filter and enable it again when you need it.
To remove filters, perform the following steps:
1. Click the Data menu in the Application bar.
2. Choose Filters from the menu.
3. Choose Remove All Filters.
Custom Filter
Using a custom filter is a good option when you want to filter data in your report using values that do not appear in the report. You can also use this option if you want users to be prompted to enter a value to use for a filter when they run this report. For the users to be prompted for a value, you must select the check box Prompt for values when report is run in viewer.
To create a custom filter, perform the following steps:
1. Open the MyFirstBusinessInsightReport report.
2. Click the column in the report on which you want to create custom filter, for example, Planned Revenue.
3. Click the Data menu on the Application bar.
4. Choose Filters.
5. Select Create Custom Filter....
6. From the Filter Condition – Planned Revenue window, choose Show only the following values> Values – Comparison > Operator and type 120000000.
7. Click OK.
NOTE: You can specify the Condition as Show only the following values or Do NOT show the following values. Also, from the Values drop-down you can specify the filter uses as Specific values, Comparison, or Range. Depending upon the choice you make here, options available to you can vary. For example, if you choose Specific Values, you can manually add values to the list; forComparison you can choose the operator you want to work with, for example, >, <, and so on. Whereas if you choose Range you can manually type in the high and low values or work with the Lowest and Highest available values for the selected column.
Options available to you in the Filter Condition window can vary depending on the data type of the selected column (refer to Figure 9.22).
8. Save the report.
Combining Filters
Using the Combined Filter option, you can combine two or more filters to filter data from the report that satisfies multiple conditions. You can combine filters using AND, OR and NOT conditions.
Figure 9.23 provides the high-level flow of the steps required to build a complex filter condition and is not in the same sequence in the list that follows.
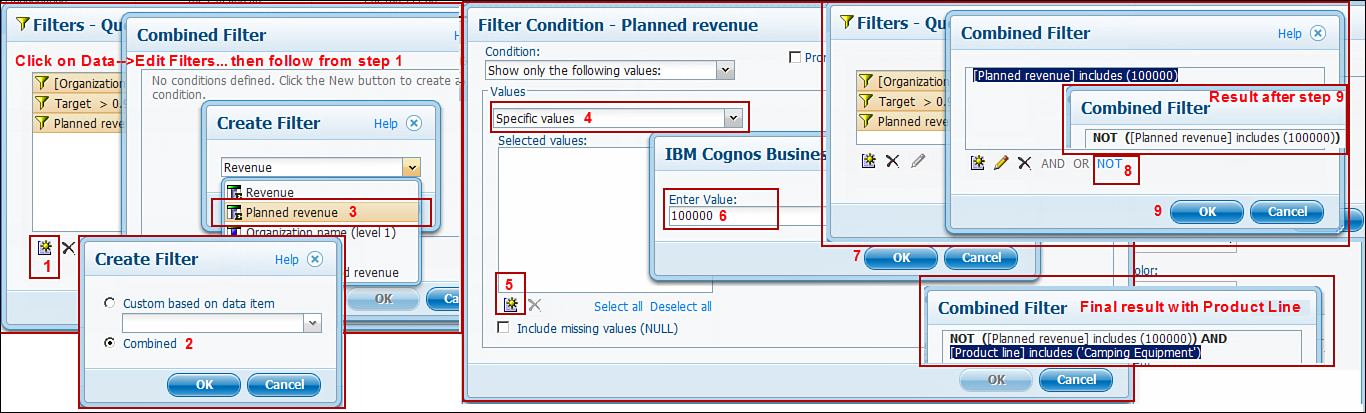
Figure 9.23. Combine multiple filters.
1. Open the MyFirstBusinessInsightReport report.
2. Click the Data menu option on the Application bar.
3. Choose Filters > Edit Filters....
4. In the Filters window, click the Add icon (looks like a bicycle gear), as shown as step 1 in Figure 9.23.
5. In the Create Filter window, click the Combined radio button.
6. In the Create Filter window, from the drop-down list, choose a column to base the filter on, for example, Planned Revenue.
7. Click OK.
8. In the Filter Condition – Planned Revenue window, specify the filter condition. In the Valuessection, from the drop-down list, choose Specific values.
9. Click the New icon and type 100000. Click OK.
NOTE: Add additional values if required via the New icon.
10. Click OK.
Observe the filter condition Planned revenue includes (100000).
11. In the Combined Filter window, click the NOT link.
NOTE: Observe the filter condition changed to NOT (planned revenue) includes (100000)).
12. Click New icon again to add another filter condition.
13. In the Create Filter window, from the drop-down list choose Product line.
14. Click OK.
15. In the Filter Condition – Product Line window, type Camping Equipment in the Keywords toSearch. Choose Contains any of these keywords.
NOTE: Although in this case Camping Equipment is displayed in the list, step 15 illustrates the usage of the Search option to quickly find the values you want to work with.
16. Click Camping Equipment, and click the green arrow to move it to the Selected values box on the right.
17. Click OK.
NOTE: Observe the filter condition – (Product line) includes (Camping Equipment).
18. Click OK again.
NOTE: Observe that the AND condition was added to combine the two filters you created. The filter expression should look like this:
(NOT ([Planned revenue] includes (100000))) AND ([Product
line] includes ('Camping Equipment'))
19. Click OK.
20. Observe that the report now has only the Camping Equipment Product line displayed in the report.
21. Save the report
Creating a Filter from the Data Tree
When working with a relational data source, you can filter the data in the report using a data item that is not included in the report. You can use measures and query items in the Source tab to filter data in the report.
To create a filter using data item from the Data Tree, perform the following steps:
1. Open the MyFirstBusinessInsightReport report.
2. Click any column in the report, for example, Revenue.
3. Click the Select Ancestor icon in the Properties pane.
4. Select List.
5. From the Source tab > expand Sales and Marketing (query) folder > expand Sales (query)namespace > expand Order Method query subject.
6. Click Order method type.
7. Right-click and choose Filter for report....
8. From the list of prepopulated values, Ctrl+Click E-mail, Fax, Mail, Telephone, and Web.
9. Click the green right arrow to move selected items to Selected Value box (on the right).
NOTE: You can click the Prompt for values when report is run in viewer to have the user provide a value to use for a filter. Also, if you want to include missing values (NULL), select the check box Include missing values (NULL).
10. Click OK.
11. Save the report.
Inserting a Chart in Your Report
You can insert a chart in your report using the Insert Chart icon from the Standard toolbar, as shown in Figure 9.24. In addition, you can convert a List or Crosstab report to a chart to represent the data in the report graphically.
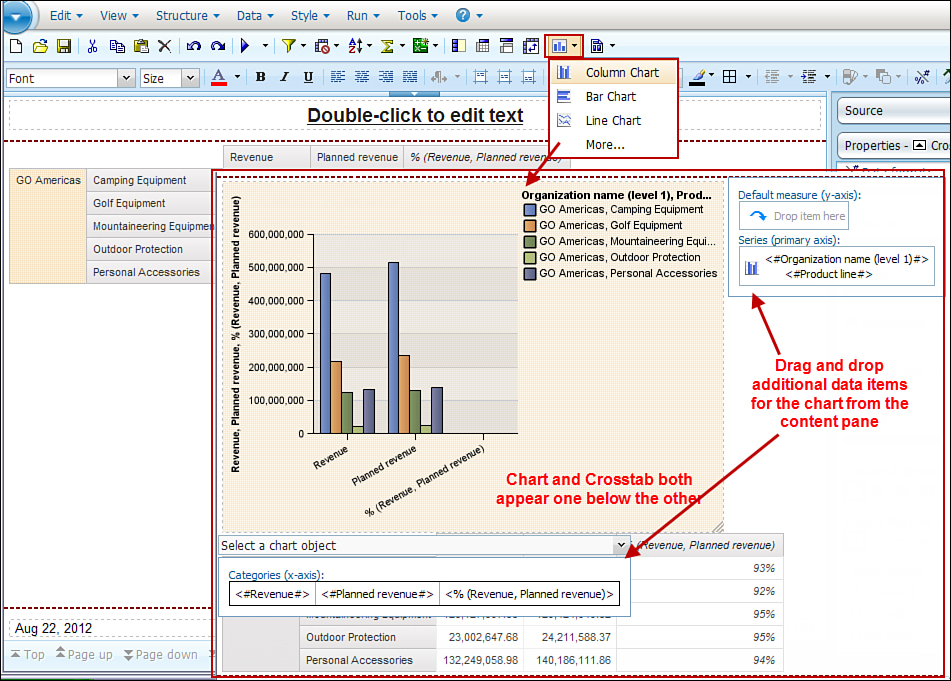
Figure 9.24. Insert a chart in a report.
If you prefer to work with the legacy Cognos 8.x charts, you can choose to do so from Tools >Options... > Advanced tab > select the check box for Use legacy chart authoring.
Figure 9.24 illustrates that when you use the Insert Chart option, the chart is already built using the data in the Crosstab; however, you can add or modify the data items reflected in the chart by dragging and dropping items from the Content pane.
To insert a Chart using data in the report, perform the following steps:
1. In Cognos Connection, click Launch > Cognos Workspace Advanced.
2. From the Select a package window, select GO Data Warehouse (query) package > select Create New.
3. From the New window, select Crosstab > click OK.
4. Expand Sales and Marketing (query) > Sales (query) > Organization > drag and dropOrganization name (level 1) to the Rows.
5. Expand Products > drag and drop Product line to the right of Organization name (level 1) asRows, as shown in Figure 9.24.
NOTE: You are nesting a Product line within the Organization name (level 1). For this you must drop the Product line in the correct drop zone, that is, when you see the three blinking lines next to the Organization name (level 1) column.
6. Expand Sales fact > drag and drop Revenue as Columns.
7. From Sales fact > drag and drop Planned Revenue as Columns to the right of the Revenue column.
8. Ctrl+Click the column header for Revenue and Planned Revenue columns > click Insert Calculation on the Toolbar > select %(Revenue, Planned Revenue) (fifth option).
NOTE: Examine the new column added to the report.
9. Click the calculated column %(Revenue, Planned Revenue) > in the Properties pane > Data Format > click the ellipses > select Percent > No. of Decimal Places > select 0 > click OK.
10. Ctrl+Click the rows GO Accessories, GO Asia Pacific, GO Central Europe, GO Northern Europe, and GO Southern Europe.
11. Click Data menu > Filters > choose Exclude > GO Accessories, GO Asia Pacific, GO Central Europe, GO Northern Europe, and GO Southern Europe.
NOTE: The report now displays only GO Americas.
12. Click the Insert Chart icon on the Standard toolbar.
NOTE: Use the More... option to see the complete list of chart types available.
13. Select the Chart type you want to work with, for example, Column Chart.
NOTE: Examine that the chart is prepopulated using the data from the Crosstab.
14. Click the Chart to review the items currently in the Chart. Observe the drop zones available.
NOTE: You can drag and drop additional items to nest data items, if required.
15. When building a brand new chart, you can drag and drop data items from the Content pane into the appropriate Chart drop zones to build the chart.
16. Save the report as MyCrosstabChartReport.
Using the Page Layout Option
Use the Page Layout option to define the page layout for your report. For example, if you have a Listand a Chart that you want to show side by side, you can choose a two-column Page Layout. On the other hand, if you want the List and Chart to show one below the other, you can choose a two-row layout. After you choose the page layout, you can drag and drop the List and Crosstab in the Page Layout box you want them to appear in, as shown in Figure 9.25.

Figure 9.25. Enhance the report using page layout.
To use the Page Layout option, perform the following steps:
NOTE: If MyCrosstabChartReport is not already open, open the report and continue with these steps.
1. Click the Page Layout icon on the Standard toolbar.
2. Select the two column table option for formatting your report.
The chart and the crosstab are moved to each of the table columns.
3. Click the Chart column of the table (left table cell).
4. Maximize the Properties pane for the left Table cell > click Border > in the Preview section > select Apply All Borders > click OK.
5. Click the right Table cell, and repeat step 4.
NOTE: You can apply additional formatting by changing the border, background color, foreground color, font, and horizontal and vertical alignment and include a table header if required.
6. Save the report.
Swapping Rows and Columns
You can use the Swap Rows and Columns option to switch the rows in the report to columns and columns to rows. This option is useful when you want to analyze the same data from a different perspective and is also used to reveal the high and low data points in the report.
Use this option when working with a Crosstab or a Chart report. In a chart the values in the x-axis become the y-axis, and the values in the y-axis become the x-axis.
To Swap Rows and Columns, perform the following steps:
1. Open MyCrosstabChartReport report.
NOTE: If you use another report, ensure the currently opened report is a Crosstab or a Chart report. This option will be enabled and available only to use for a Chart or Crosstab report.
2. Click the Structure option on the Application bar.
3. Choose Swap Rows and Columns.
NOTE: Alternatively, you can click the Swap Rows and Columns icon on the Standard toolbar.
4. Save the report.
Suppressing Empty Cells in a Report
Use the Suppression options to suppress empty cells in the report because too many empty cells make the report sparse and difficult to read. You can choose from any of the following suppression options available to you:
• No Suppression (default)
• Suppress Rows and Columns
• Suppress Rows Only
• Suppress Columns Only
• Suppression Options....
In addition, using Suppression Options... you can specify what you want to suppress via the radio buttons, that is, None, Rows and Columns, Rows only, and Columns only. Also, you can specify what you want to suppress for the chosen option via the check boxes, that is, Zero values, Divide by Zero,Missing values, and Overflow values, as shown in Figure 9.26.

Figure 9.26. Steps to suppress rows and columns in the report.
To suppress empty cells in a report, perform the following steps:
1. Open the MyCrosstabChartReport report.
3. Choose Suppression Options... (or choose the one appropriate for your report).
4. From the Suppression Options window, in the Suppression section, click Rows and Columns.
5. From the available Suppress options, click Zero values and Missing values.
6. Click OK.
7. Save the report.
Alternatively, you can choose the Suppress option from the Standard toolbar.
Enabling/Disabling Page Header and Footer
Use the Page Header & Footer option to enable or disable the page header and footer in the report. By default, the header and footer always appear in the report you create; however, you can choose not to show them if required. You can choose to show both, only the header, or only the footer, or none.
When you choose to include a header and footer in the report, you can populate them with values you require by dragging and dropping items from the Toolbox tab, for example, Text item for titles, anImage for a company logo, and so on, as shown in Figure 9.27.

Figure 9.27. Set up a page header and footer in the report.
To enable/disable a page header and footer, perform the following steps:
1. Open the MyCrosstabChartReport report.
2. On the Application toolbar, click Structure > Headers & Footers > Page Header & Footer....
3. In the Page Header & Footer window, select Header/Footer check box as required.
4. Click OK.
5. Drag and drop Text Item from the Toolbox tab to the leftmost box in the footer, and type Sample Outdoor Confidential.
6. Drag and drop Page Number from the Toolbox to the middle box in the footer.
7. Drag and drop Date from the Toolbox to the right box in the footer.
NOTE: You cannot disable the Body of the report.
8. Save the report.
Running Reports
Use the Run Reports option to run the report to present the data from the database. You see sample data in the report in the Page Preview mode. The complete report data can be seen by running the report. The default report output is in HTML format. You can choose to get the report output in PDF,Excel 2007, Excel 2002, Delimited Text (CSV), or XML, as shown in Figure 9.28.
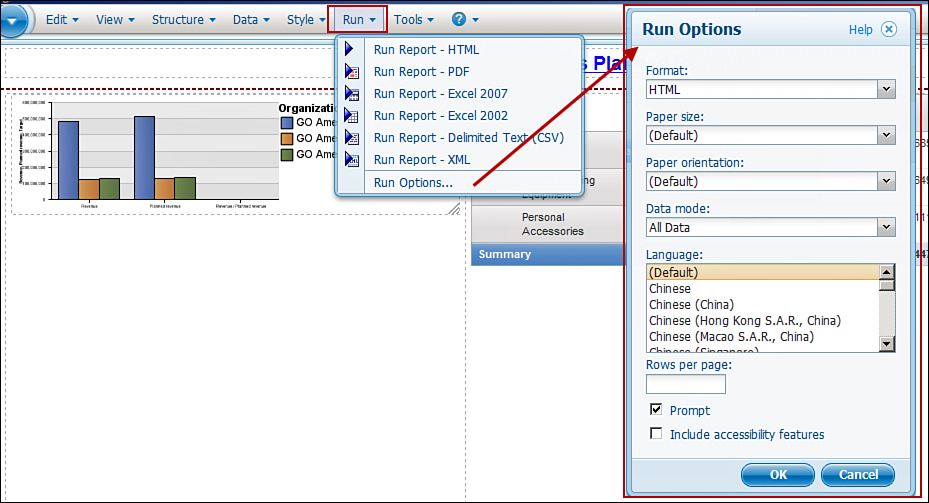
Figure 9.28. Report Run options.
In addition, you can use the Run Options... to specify the following:
• Format: Use this option to specify the report format, for example, HTML, PDF, Excel 2007, Excel 2002, Delimited text (CSV), or XML.
• Paper size: Use this option to specify the Paper size for the report, for example, Letter, Legal, 11x17,A3, A4, B4 JIS, or B5 JIS.
• Paper orientation: Use this option to specify paper orientation, for example, Portrait orLandscape.
• Data mode: Use this option to specify if you want to work with All Data (default), Limited Data, or No Data when working with your report. During the design of the report, you may want to restrict the traffic to the server by using the Limited Data or No Data option until you are ready to run the report to fetch all the related report data. This setting impacts the Run Reports only; it does not limit the data shown in the Cognos Workspace Advanced interface.
• Language: Use this option to specify the report Language, for example, English or Chinese.
• Rows per page: Use this option to specify the number of rows to display on each page. You can increase or decrease the default page size by providing a value here.
• Prompt: Use this option to enable/disable the prompt option in a report via the check box. This is applicable only to prompt reports that require user input to run the report.
• Include accessibility features: Use this option to enable/disable Include accessibility features via the check box. To include accessibility features in the report ensure the check box is selected. When this feature is enabled, additional information is collected to support accessibility features.
To run reports, perform the following steps:
1. Open the MyCrosstabChartReport report.
2. In the Application toolbar, click Run.
3. Choose Run Report – HTML.
NOTE: The report output appears in a new browser for IBM Cognos Viewer. Click the x icon, on the top right of the window to close the browser.
Drill Options
You can specify the drill behavior in the report using the Drill Options. You can choose one, both, or none depending upon your reporting need. Drill-up and Drill-down options enable you to analyze the data in the report via drill-up and drill-down functionality. Drill-down enables you to analyze a lower and more detailed level of information and Drill-up enables you to navigate up to the higher-level information.
Drill-through options enable you to navigate from the current report to another report for additional information. For example, it is common for business users analyzing data in a List report to know the details behind summarized values in the report. In such situations you can enable drill through to another report that provides the detailed information on the summaries, as shown in Figure 9.29. You can drill through to another report only if drill-through reports have been set up for use by the report author in Report Studio.
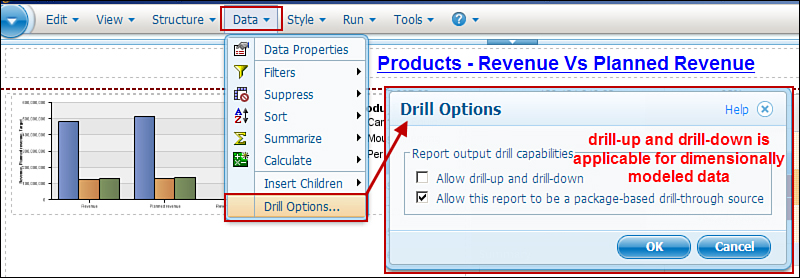
Figure 9.29. Enable and disable drill options.
To enable/disable drill-through options, perform the following steps:
1. Open the MyCrosstabChartReport report.
2. On the Application toolbar, click the Data menu > Drill Options....
3. Select the Allow this report to be a package-based drill-through source.
4. Click OK.
NOTE: The option Allow drill-up and drill-down is only applicable when you work with dimensionally modeled data.
5. Save the report.
Using the Pivot List to Crosstab Option
The Pivot List to Crosstab option is useful when you want to analyze the same data available in the List report from another perspective. The column you select prior to clicking Pivot List to Crosstabbecomes the column heading or column edge in the Crosstab report. The unselected columns become rows and nested rows. If there is only one measure (numeric value) in the report, the measure column appears as the cell in the crosstab. Any additional measures in the report appear as columns.
To use the Pivot List to Crosstab, perform the following steps
NOTE: If not already open, open the MyFirstBusinessInsightReport report.
1. In the List report, click the column you want to appear as the column in the Crosstab report.
2. Click Structure menu > select Pivot List to Crosstab.
NOTE: Alternatively, you can click the column you want to appear as the column in the Crosstab report and click the Pivot List to Crosstab icon on the Standard toolbar.
Summarizing Report Data
Cognos Workspace Advanced enables you to summarize data in your report. The options available to you are Automatic Summary, Total, Count, Average, Minimum, and Maximum. Summaries do not include NULL or missing values. You can drag and drop the summarized data to other locations in the report. Figure 9.30 shows how to summarize data in the report.
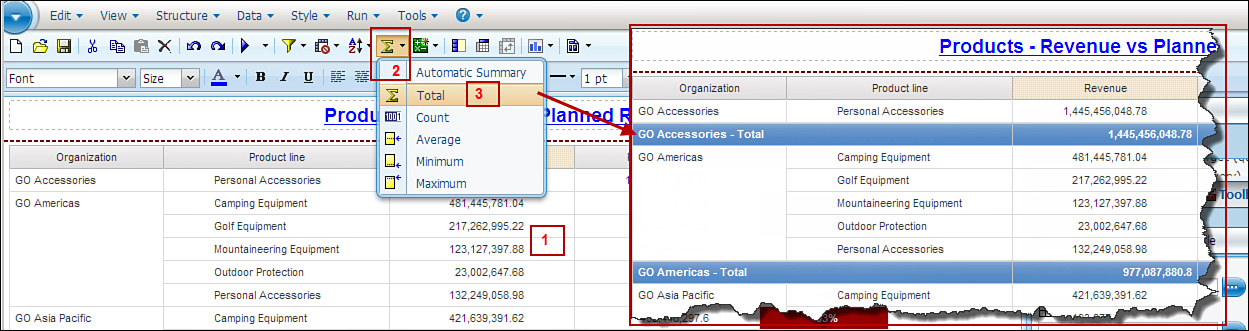
Figure 9.30. Summarize data in the report.
• Total: Enables you to sum values in the selected report column.
• Count: Enables you to count all values in the selected report column.
• Average: The selected report column is calculated by adding all the values in the selected report column and dividing it by the count of values.
• Maximum: Returns the largest value in the selected report column.
• Minimum: Returns the smallest value in the selected report column.
To summarize data in the report, perform the following steps:
1. In Cognos Connection, click Launch > Cognos Workspace Advanced.
2. From the Select a package window, select GO Data Warehouse (query) package > select Create New.
3. From the New window, select List > click OK.
4. Expand Sales and Marketing (query) > Sales (query) > Organization > drag and dropOrganization name (level 1).
5. Expand Products > drag and drop Product line to the right of Organization name (level 1).
6. Expand Sales fact > drag and drop Revenue and Planned Revenue to the end of the List.
8. From the Application menu choose the Data menu > Summarize > Total.
NOTE: Revenue is now summarized by Organization. Observe that the data was summarized by the grouped column.
9. Save the report as MyListReport.
Alternatively, you can also summarize using the Summarize icon on the Standard toolbar. You can delete the summary line if you do not need it.
Showing Content When No Data Is Available
Use the No data contents option to avoid showing an empty data container like List, Crosstab, orChart. You can display content or text when there is no data available in the database to show in the report. By default, No Data Available appears; however, you can choose to show something else in the empty data container.
To configure the No data contents option, perform the following steps:
1. Open the MyListReport report, if not already open.
2. Click any column in the report, for example, Revenue.
3. Click the Select Ancestor icon in the Properties pane, and choose List.
4. In the Properties pane, click Maximize > click the ellipses for No data contents option > ensure Specified text is selected > type There is no data available for this report.
NOTE: From the No Data Contents window, you can choose from already existing radio button values, for example, No Content, Content Specified in the No data tab, or Specified Text (Default). To test this option you can set a data tree filter (discussed earlier), for example, quantity < 0.
5. Click OK.
6. Click the Filters icon on the Toolbar > select Edit Filters....
7. On the Filters window, click the Add icon > in the Create Filter window > select Combined > clickOK.
8. In the Create Filter window > select Organization Name (level 1) > click OK > in the Filter Condition window > Ctrl+Click and select all entries in the list > click the green right arrow > clickOK.
9. In the Combined Filter window, click NOT > click OK > click OK again.
NOTE: There is no data displayed in the report now because you applied a filter that filtered out all the Organizations in the database.
10. Run the report.
NOTE: If the report has no data, a message There Is No Data Available for This Report displays for the user in Cognos Viewer.
11. Click the Filters icon > Edit Filters....> in the Filters window, click the filter you created in step 8 > in the Usage section > select Disabled > click OK.
12. Save the report.
Sorting Report Data
You can arrange the data in the report in ascending or descending order to suit your reporting requirement. You can use one of the two options available for sorting: Sort in Layout and Other Sort Options.
Using the Sort in Layout option, you can define Ascending, Descending or Don’t Sort. Use theDon’t Sort option to remove any sort order already applied on the data item.
Use the Edit Layout Sorting... (under Other Sort Options), to define the sort order on multiple columns or grouped columns.
Sorting on a Single Column
To sort on a single column, perform the steps that follow:
1. Open the MyListReport report.
2. Click the column you want to sort, for example, Revenue.
3. Click the Sort icon on the Standard toolbar.
4. Choose Ascending (or the option suitable to your need).
5. Save the report.
Sorting on Multiple Columns or Grouped Columns
Refer to Figure 9.31 for steps on sorting on multiple/grouped columns as described in the list that follows.

Figure 9.31. Steps to sort data on multiple columns or grouped columns.
1. In Cognos Workspace Advanced, click the New report icon to create a new report.
2. Use the Go Data Warehouse (query) package for this report; choose List.
3. From the Insertable Objects pane (Source tab), drag and drop onto the List GO Data Warehouse (query) > Sales and Marketing (query) > Sales (query) > Retailers > Region.
4. From the Insertable Objects pane (Source tab), drag and drop onto the List GO Data Warehouse (query) > Sales and Marketing (query) > Sales (query) > Order Method >Order method type.
5. From the Insertable Objects pane (Source tab), drag and drop onto the List GO Data Warehouse (query) > Sales and Marketing (query) > Sales (query) > Products > Product line.
6. From the Insertable Objects pane (Source tab), drag and drop onto the List GO Data Warehouse (query) > Sales and Marketing (query) > Sales (query) > Sales fact > Quantity.
7. Ctrl+Click the Region and Order method type column > click the Group/Ungroup icon on the Standard toolbar.
8. Click any column in the report > click the Sort icon > choose Edit Layout Sorting....
9. In the Grouping & Sorting window, drag and drop Region from Data items under the Region (Sort List) in the Groups section, as shown in Figure 9.31.
10. In the Grouping & Sorting window, drag and drop Order method type from Data items underOrder method type (Sort List) in the Groups section, as shown in Figure 9.31.
11. In the Grouping & Sorting window, drag and drop Quantity from Data items under Detail Sort List in the Groups section, and click the sort icon at the bottom of the screen.
NOTE: The sort icon at the bottom of the Grouping & Sorting window is a toggle that enables you to specify your preference as ascending or descending. Alternatively, you can also double-click the data item in the Groups section to change the sort preference.
12. Click OK.
NOTE: Review the report layout now. The Region column is sorted in ascending order, the Order method type is sorted in ascending order, and Quantity is sorted in descending order for each Order method type.
13. Save the report as MyOrderMethodListReport.
Sorting on Data Item Not Included in the Report
Use this option to sort columns in a List report using data items available to you in the Insertable Objects pane (Source tab); however, it is not used to display on the report:
1. Open the MyListReport report.
2. Locate the data item in the Insertable Objects pane (Source tab), for example, Product type.
3. Right-click on Product type > choose Sort for report....
If your data source is relational, you can use measures and query items. Whereas for dimensional data sources, you can use measures and levels to sort.
Lineage
Use the Lineage option to view the source of a data item you want to either use in your report or validate the lineage information of a data item already used in the report. Lineage enables you to trace the metadata through the package and the data sources used in the package.
For example, the Planned Revenue column in the report is a calculated column based on unit price and quantity, for example, Unit price * Quantity, as shown in Figure 9.32.
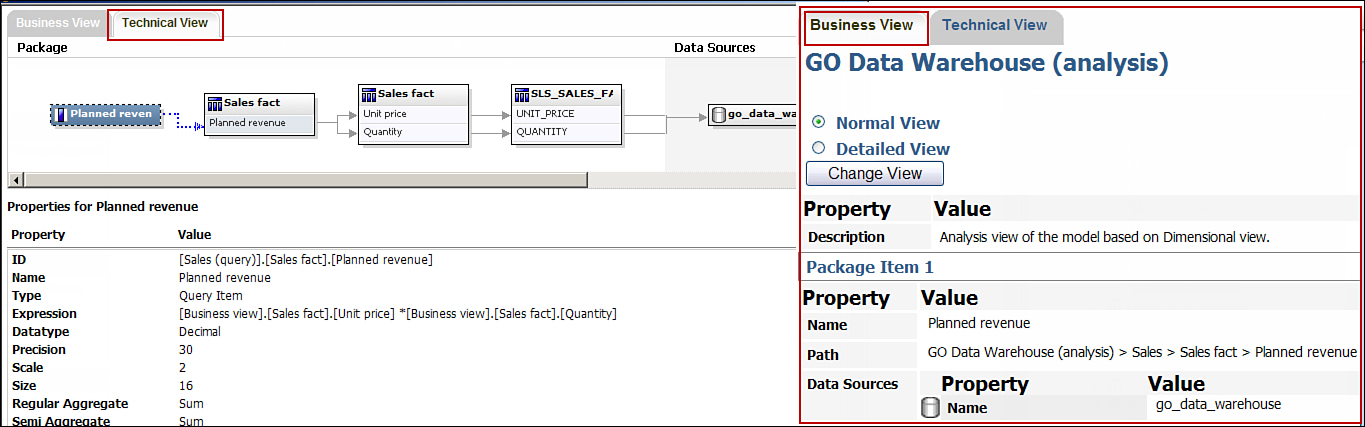
Figure 9.32. Lineage Business and Technical View options.
To view lineage information for a data item source, perform the following steps:
1. Open the MyListReport report.
2. To view the Lineage information on the Planned Revenue column, click Sales fact > Planned Revenue.
3. Right-click Planned Revenue > choose Lineage.
The Lineage window has two tabs, Business View and Technical View. The Business View tab displays description, owner, contact, path of the data item, and so on.
The Technical View displays a pictorial view of the metadata information for Planned Revenue, itsdata type, size, precision, and so on, as shown in Figure 9.32. You can click each item in the Technical View to view its metadata definition.
WORKING WITH DIMENSIONAL STYLE REPORTS
Dimensional style reports are appropriate when you want to use the drill-up and drill-down features in the report. The Dimensional style report uses dimensional data sources, for example, OLAP and Dimensionally Modeled Relational (DMR) data. Refer to the details in the “Reporting Styles” section earlier in this chapter.
Dimensionally modeled data is easy to use by business users because they can see the values to use in the report for example, the values in the data items as members without having to run the report.
Creating a Dimensional Report
Dimensional reports are created in the same way you create a relational report. The point to remember is that you must select a package that has been modeled dimensionally. The features available to you when working with the reports can vary depending upon the type of package, for example, Relationaland Dimensional. If you are unsure, refer to the Insertable Objects pane shown in Figure 9.3. If the package structure matches Figure 9.3, the package is relational. If the Insertable objects pane in the package structure is similar to Figure 9.4, with dimension and hierarchies, the package is dimensional.
To create a dimensional report, perform the following steps:
1. In IBM Cognos Connection, click Launch > Cognos Workspace Advanced.
2. In Select a Package window, choose the Go Data Warehouse (analysis) package > Public Folders > Great Outdoors Samples > Samples > Models > Go Data Warehouse (analysis), as shown in Figure 9.33.

Figure 9.33. Steps to create a dimensional report.
3. Choose the Create New option to create a new dimensional report.
4. Ensure the package name is correct in the Package section of the New window.
5. In the New window, select the report layout required for the dimensional report, for example,Crosstab > click OK.
NOTE: This brings you to Cognos Workspace Advanced with a blank Crosstab report layout. Also, notice that when working with dimensional reports the user interface is different; you now have at the top of the screen Page layers and Context filter options like in Analysis Studio.
6. In the Insertable Objects pane > Source tab > click the View Metadata Tree icon, if not already selected.
NOTE: Examine the options available to you on the top right of the Source tab pane.
7. From the Insertable Objects pane > Source tab, navigate to GO Data Warehouse (analysis)> Sales and Marketing (analysis) > Sales > Organization; drag and drop Organization hierarchy as rows. If prompted, select Root members to display the highest-level information, as shown in Figure 9.34.
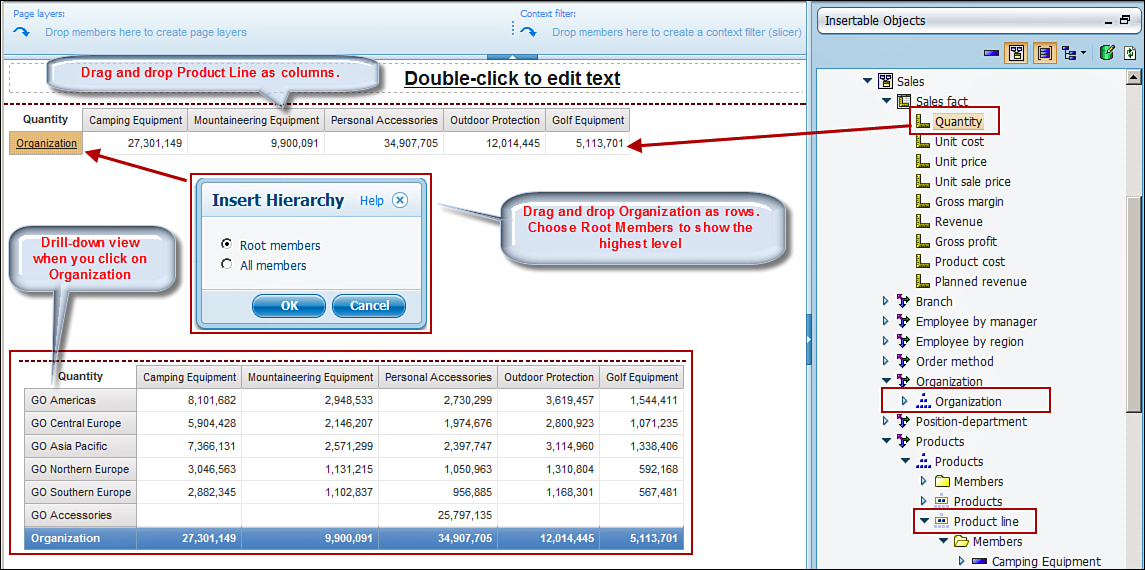
Figure 9.34. Using dimensional objects to build the report.
8. Next, navigate to Go Data Warehouse (analysis) > Sales and Marketing (analysis) > Sales> Products dimension > Products. Drag and drop Product Line Level to the Column area.
9. From Go Data Warehouse (analysis) > Sales and Marketing (analysis) > Sales > Sales Fact > Quantity, and drag and drop Quantity to the Measures area in the report. Your report should resemble output shown in Figure 9.34.
You can drill down from there to see the lower level of details. If you do not require the highest level to be the default view, you can drag and drop the selected members or level you need to display. Observe the summary is available at the bottom of the report. You can keep it if you require or click the summary row and choose Delete from the Standard toolbar.
10. Click Organization, and notice the report now displays the lower level of information.
11. Save the report as SampleOutdoorProductsReport.
Nesting Rows
Simply speaking, nesting means embedding one object in another. It broadens the perspective of data exploration and enables you to see a bigger picture. You can nest rows and/or columns depending on your analysis needs. The nested row/column can be from multiple levels of the same dimension. Although nesting is helpful, too many levels of nesting may actually make the report difficult to interpret or read. It is common to nest up to two or three levels. Figure 9.35 shows how to nest data in a dimensional report.
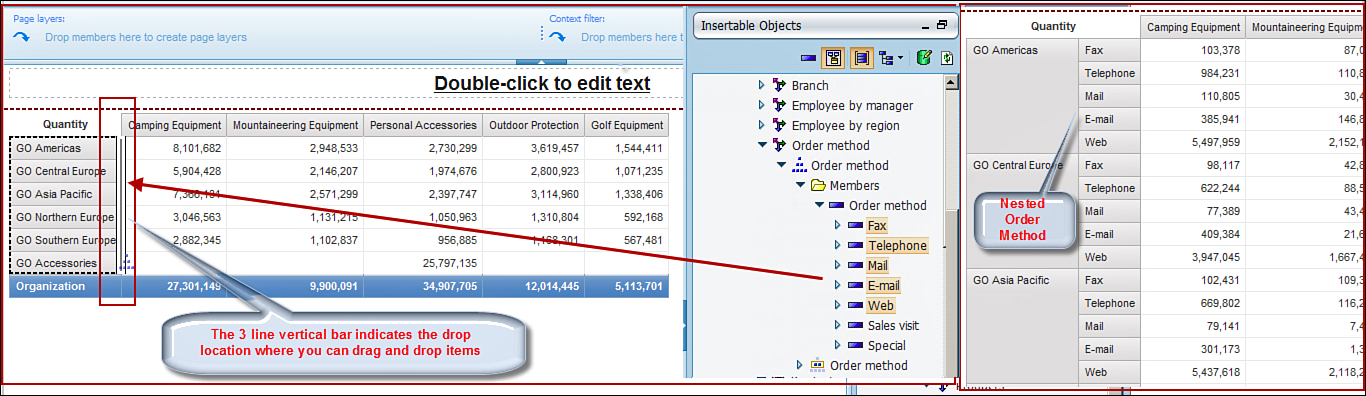
Figure 9.35. Nest data in a dimensional report.
To nest rows, perform the following steps:
1. Open the SampleOutdoorProductsReport report.
2. From the Source tab on the right of the screen, navigate to Go Data Warehouse (analysis) >Sales and Marketing (analysis) folder > Sales folder > Order Method, navigate to theMembers folder > expand Order Method, Ctrl+Click Fax, Telephone, Mail, E-Mail, and Web. Drag and drop these items to the right of Organization (you should see the three vertical blinking lines before you release the mouse button), as shown in Figure 9.35.
You can cherry-pick selected items from one or more levels in the same dimension to create aSelection-based set. You can add these items by Ctrl+Clicking the items you want to drag on to the report. When you drag items this way, the item is added without its children.
You must release the mouse button only when you see three blinking vertical bars next to the Organization values. These lines indicate the drop zone.
This view enables you to examine the sales made by each Organization and which Order Method is most effective in each Organization.
Also, you can drop the item to the left or right of items already in the report, depending on your requirement.
3. From the Order Method Members folder, click Sales visit, and drag and drop it under Web. Alternatively, you can right-click and select Insert to add it to the report.
4. Navigate to the Toolbox tab (in the Insertable Objects pane), and drag and drop a Crosstab Space from the Toolbox to space items between crosstab items. Wait until you see the horizontal blinking lines that indicate the drop zone. You can drop Crosstab Space between rows or columns. For example, in a nested column report, you can drop a Crosstab Space when the grouped values change and enhance readability.
5. Undo the change.
6. Drag and drop Crosstab Space (with fact cells), and drop it below Sales Visit. Ensure that empty cell is added on the crosstab edge. The measures are added in the fact cells. You can dropCrosstab Space (with fact cells) in row or a column.
7. Undo the change.
8. Save the report.
Nesting Columns
Columns can be nested in the similar way you nest rows; the only difference is the drop location for the item is a column. You can drag and drop items above or below the items already existing in the report, as shown in Figure 9.36.
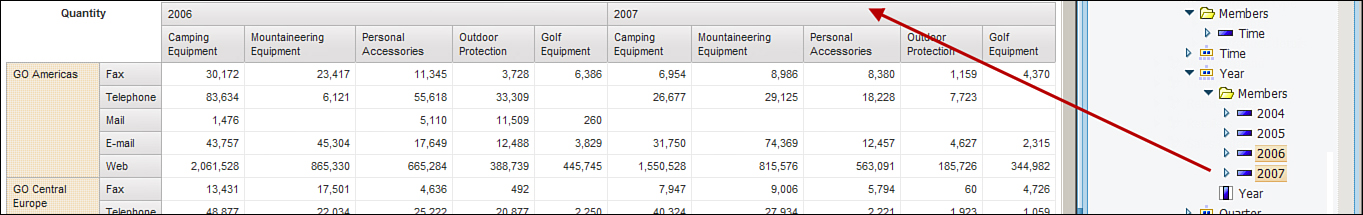
Figure 9.36. Nested columns in a dimensional report.
To nest columns, perform the following steps:
1. Open the SampleOutdoorProductsReport report.
2. Navigate to the Time dimension > Year > Members folder > Ctrl+Click 2006 and 2007 (or any two available years).
NOTE: You must drop the item above Product line only when you see the three bar horizontal lines indicating the drop zone.
4. Undo the change.
5. Save the report.
Notice that when you drag single item to the report, its children are included. However, when you Ctrl+Click to select certain items to drop onto the report, the items are dropped onto the report without their children.
You can nest rows and columns in a Crosstab report for enhanced data exploration with an additional wider perspective of the business.
Although nesting is useful, it makes the report difficult to read if there are too many levels of nesting. You may want to use two or three levels of nesting to keep the report easy and simple to read.
Move nested rows and columns to change nesting levels. (You can switch nesting levels except in cases where there is parent and child level nesting.) You cannot nest the parent within the child level.
Replacing Current Row/Column Values
If you want to replace the existing row/column value rather than nest, you can replace the current row/column values by dragging and dropping values from the Source tab on top of the existing values as shown in the list that follows:
1. If not already open, open SampleOutdoorProductsReport report.
2. Expand Retailers dimension > Members folder > drag and drop Retailers on top ofOrganization values.
3. Click Undo to undo the change.
You can follow the same process to replace the column values in the report.
Suppressing Empty Cells
Use the Suppress option to hide rows and columns that are empty or zero values in the report. This can help make the report more readable, as shown in Figure 9.37 and described in the list that follows.
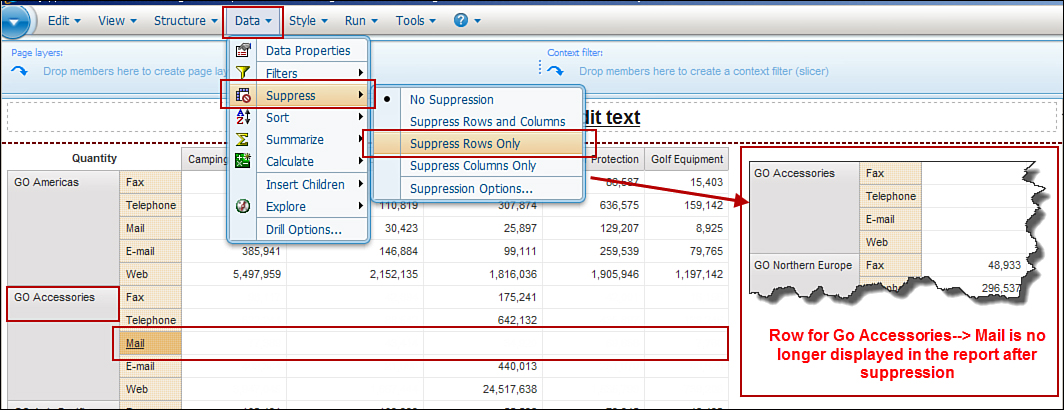
Figure 9.37. Steps to suppress empty rows in a report.
The options are same whether you use dimensional or relational reporting style.
1. Open the SampleOutdoorProductsReport report (if not already open).
2. For GO Accessories, notice that there are no values for Mail.
NOTE: You can hide the empty cells in the report via the Suppress option.
3. Click Data > Suppress > Suppress Rows Only.
NOTE: The empty rows, for example, Blank row in GO Accessories > Mail are no longer displayed in the report, as shown in Figure 9.37 as the rightmost box displaying results. Although the example illustrates and focuses on GO Accessories>Mail, all other blank rows were also removed from the report.
4. Save the report.
Filtering Data
You can use filters to filter out unwanted data from the report. Data that does not meet the filter criteria is not retrieved from the database. When working with dimensional data, you can filter on measures and members.
You can create context filters, top and bottoms filters, or combine filters to create complex filters. Filters on measures are applied after automatic aggregation is done while for members the filters are applied before aggregation; this is the default behavior. You can use the Edit Filters... option to change this default behavior.
In dimensional reporting style you have the flexibility to work with all the members or identified set of members, that is, a subset. As in the “Nesting Rows” section earlier, you choose Fax, Telephone, Mail, E-Mail, and Web from the entire list by Ctrl+Clicking these items and dragging them onto the report.
To create a filter on a data item, you must first select the data item; if you click two or more data items in the report and click filter, you can create a range filter.
There are several ways to filter data in the report. Options available to you are context-sensitive. For example, options available for text and numeric values will be different, options available when you select a single column or multiple columns will be different, and so on.
Using Exclude and Include Filters
One of the ways to filter data from the report is to use the Exclude and Include filters. First, click the column(s)/row(s) that you want to include or exclude from the report and then perform the following steps:
1. Open the SampleOutdoorProductsReport report.
2. Click Camping Equipment.
3. Click the menu option Data > Filters.
NOTE: The options available to you are Include Camping Equipment, Exclude Camping Equipment,Create Custom Filter..., and Edit Filters....
4. Choose Include Camping Equipment.
NOTE: All the other Product lines, for example, Mountaineering Equipment, Personal Accessories, and so on, are removed from the report.
5. Undo the selection.
6. Now Ctrl+Click Camping Equipment and Mountaineering Equipment.
7. Click the menu option Data > Filters.
NOTE: The options available to you are Include Camping Equipment, Mountaineering Equipment,Exclude Camping Equipment, Create Custom Filter..., and Edit Filters....
8. Choose Exclude Camping Equipment, Mountaineering Equipment.
NOTE: The report displays all the Product lines except Camping Equipment and Mountaineering Equipment.
9. Undo the selection.
10. Save the report.
Creating Custom Filters
The Create Custom Filter option works in the same way as when working with relational data. Refer to the section “Custom Filter” under the “Working with Relational Style Reports” parent section.
Removing All Filters
The Remove All Filters option works in the same way as when working with Relational data. Refer to the section “Removing All Filters” earlier in this chapter.
Editing Filters
The Edit Filters option works in the same way as when working with relational data. Refer to the earlier section “Editing Filters.”
Combining Filters
You can combine two or more filters to create complex filter conditions as documented earlier in the “Combining Filters” section under the “Working with Relational Style Reports” parent section.
Context Filters
Context filters can be used with dimensionally modeled data only. Using Context filters or the slicer filter enables you to focus on the data you want to work with. When you add a member to the Context filter, the report filtered by the Context filter, and all other values are not included in the report. When you apply a Context filter to the report, the rows (members) that do not meet the filter criteria are not removed from the report; rather they appear as blank cells unlike traditional filters where the data is removed from the report.
Some key point to remember when working with Context filters follow:
• It is recommended you use members from hierarchies that are not already on the edge of the crosstab and use only one member per hierarchy.
• Use only those members from hierarchies that do not already exist on the edge of the crosstab.
• You can create multiple Context filters to filter across two or more hierarchies.
• Existing summary values are recalculated to take into account the Context filters.
• Context filters impact only the data in the report and not its general layout.
To apply a Context filter, drag and drop data items from the Source tab to the Context filter area of the overview area, as shown in Figure 9.38. The items you use to create the Context filter automatically appear as report header when the report is run. You can have multiple items as Context filters.

Figure 9.38. Define Context filters in a report.
Creating Context Filters
You want to create a Context Filter to analyze how many products were sold via the web in 2007. Perform the following steps:
1. Open the SampleOutdoorProductsReport report (if not already open).
2. From the Source tab, navigate to Go Data Warehouse (analysis) > Sales and Marketing (Analysis) folder > Sales folder > Retailers > Members folder > Retailers. Drag and drop retailers on top of the Organization column.
NOTE: This replaces the Organization values with the Retailer Information, for example, Americas,Asia Pacific, Northern Europe, Central Europe, and Southern Europe, as shown in Figure 9.38.
3. In the Source tab, expand Order Method > Members folder > drag and drop Web to theContext filter area.
NOTE: Observe that the data in the report changes to reflect only Web sales; other aspects of the report layout remains unchanged. In addition, notice that Web has been added as the report header automatically indicating the data included in the report.
4. Expand Time dimension > Members folder > drag and drop 2007 next to Web in the Context filter area.
Observe that the Context filter area now displays two filters, Web and 2007. Also, 2007 is added to the report header. You can create multiple Context filters and filter across two or more different hierarchies.
5. Save the report.
Removing Context Filters
To remove Context filters, perform the following steps:
1. Open the SampleOutdoorProductsReport report (if not already open).
2. To remove a Context filter, click the filter you want to remove in the Context filter section of theOverview area, for example, Web or 2007.
3. In the Context filter section, click the Web drop-down arrow > Delete.
4. Right-click 2007 > select Delete.
5. Save the report.
Inserting Children
Use the Insert Children option to display children of the selected member before, after, or nest them in the report. Depending on your selection, the child entries will be displayed before the selected item in the report, as shown in Figure 9.39 and described in the list that follows.
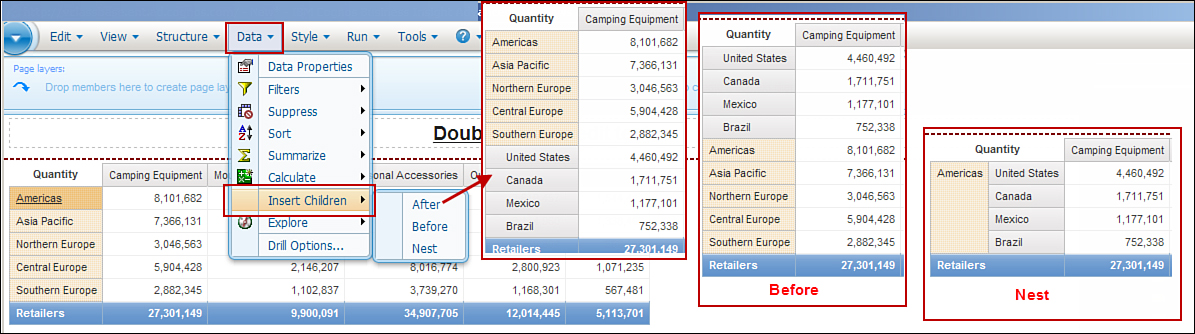
Figure 9.39. Insert Children options – After, Before, and Nest with respective outputs.
• Before displays the child entries before the selected item is displayed.
• After displays the child entries after the selected item is displayed.
• Nest actually nests the child entries within the original entry. Entries that were not selected will not be displayed in the nested report.
Explore
The Explore option is only available when working with dimensional data. The Explore option provides additional features that you can you use to manipulate data in the report, for example, Drill Down, Drill Up, Top, Bottom, and so on:
• Drill Down enables you to drill down to the next lower level of detail of the selected entry.
• Drill Up enables you to drill up to the next upper level of the selected entry.
NOTE: You can drill up/down on rows or columns. To drill up/down on both rows and columns, you can click the value in the intersection cell, that is, measure. When you reach the lowest level in the drill-path, you cannot go any further; you can drill up from there to go back to the higher levels. Cognos Workspace Advanced determines if you can drill up/down on an item based on the dimensional structure.
The drill paths are predefined based on the reporting requirement and data availability in the data source. If your drill path needs to be enhanced/modified, you may discuss with the IBM Cognos BI Administrator or appropriate person who can work with the Metadata Modeler to implement approved changes.
• Exclude Members option enables you to remove individual items that you do not need in your analysis, as shown in Figure 9.40.
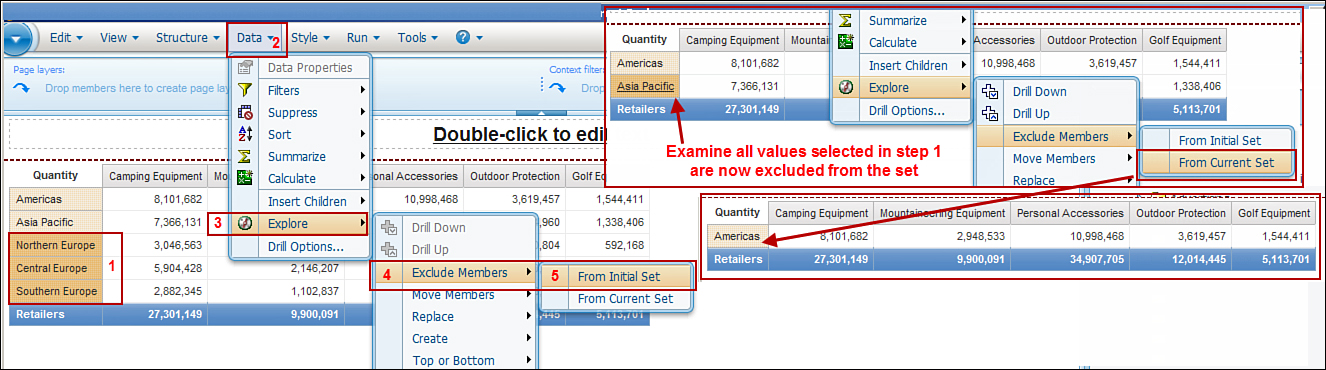
Figure 9.40. Steps to Exclude Members from the Initial Set.
• Exclude Members provides two options:
• From Initial Set: Use this option to remove members from the original set.
To Exclude members from Initial Set, follow the steps listed here usingSampleOutdoorProductsReport report:
1. Ctrl+Click the item you want to exclude, for example, Northern Europe, Central Europe, andSouthern Europe.
2. From the Data menu > Explore > Exclude Members > From Initial Set.
NOTE: When you apply the Top n filter (discussed later) and then exclude a member from the Initial set, if the member was in the Top n filter, it will be excluded from the initial set and Top n filter is reapplied.
• From Current Set: Use this option to remove members from the set currently displayed in the report.
To Exclude members from the Current Set, follow the steps listed here usingSampleOutdoorProductsReport report:
1. Click the member to exclude (or Ctrl+Click for multiple selections), for example, Asia Pacific.
2. Click the Data menu> Explore > Exclude Members > From Current Set.
3. Undo the Exclude Current set filter.
4. Undo again to undo the Exclude Initial set filter.
• Move Members: Use this option to format the report in a way that is meaningful for your audience. For example, for a European audience you may want to display the European numbers first, whereas for Americas you may want to display the Americas numbers first in the report.

Figure 9.41. Steps to Move Members – options and respective output displays.
• To Top: Click (or Crtl+Click to select multiple items) on the item you want to move to the top of the report.
1. Open the SampleOutdoorProductsReport report (if not already open).
2. Ctrl+Click Northern Europe, Central Europe, and Southern Europe.
3. Click the Data menu > Explore > Move Members > To Top.
• To Bottom: Click (or Crtl+Click to select multiple items) on the item you want to move to the bottom of the report.
1. Ctrl+Click Northern Europe, Central Europe, and Southern Europe.
2. Click the Data menu> Explore > Move Members > To Bottom.
• Replace: Use this option to replace the selected member with its children, level members, an individual member, a set of selected values, or an intersection (tuple), as shown in Figure 9.42.
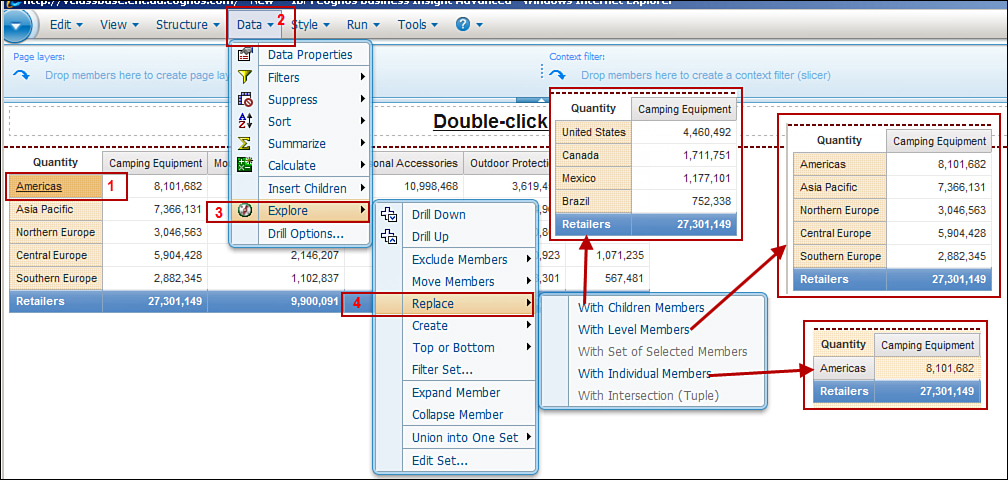
Figure 9.42. Steps to Replace data in a dimensional report – its options and respective output displays.
• With Children Members: Replaces the member with its child members.
1. Open the SampleOutdoorProductsReport report (if not already open).
2. Click Americas > Data menu > Explore > Replace > With Children Members.
NOTE: The column values are now replaced with the children members of Americas, that is, United States, Canada, Mexico, and Brazil, as shown in Figure 9.42.
3. Undo the change.
• With Level Members: Replaces the current member with its level members
1. Open the SampleOutdoorProductsReport report (if not already open).
2. Click Americas > Data menu > Explore > Replace > With Level Members.
NOTE: The column values reflect the level members of Americas, that is, Asia Pacific, Northern Europe, Central Europe, and Southern Europe, as shown in Figure 9.42.
3. Undo the change.
• With Set of Selected Members: Replaces a set of members with a set you define. Select the members you want to keep in the new set, and choose Replace > With Set of Selected Members.
• With Individual Members: Replaces a set of members with one or more individual members. You should select the members you want to keep; then choose Replace > With Individual Members.
1. Open the SampleOutdoorProductsReport report (if not already open).
2. Click Americas > Data menu > Explore > Replace > With Individual Members.
NOTE: Notice that the column value now includes Americas only.
3. Undo the change.
• With Intersection (tuple): Replaces members or set with intersection. Select the member; then choose Replace > With Intersection (Tuple)
1. Open the SampleOutdoorProductsReport report (if not already open).
2. Ctrl+Click Camping Equipment and Americas.
3. From the Data menu > Explore > Replace > With Intersection (Tuple).
NOTE: Only the data for the selected intersection is now displayed in the report.
4. Undo the change.
• With Set of Selected Members: Replaces the current set with the selected set. Unlike the With Intersection (Tuple) option, you can use this to create a set using members of the same hierarchy.
1. Open the SampleOutdoorProductsReport report (if not already open).
2. Ctrl+Click Americas and Asia Pacific.
3. From the Data menu > Explore > Replace > With Set of Selected Members.
4. Undo the change.
NOTE: The data in the report now consists of Americas and Asia Pacific only.
Options available are context-sensitive.
• Create enables you to add duplicates, child members, or intersection of two or more members from different hierarchies, as shown in Figure 9.43.
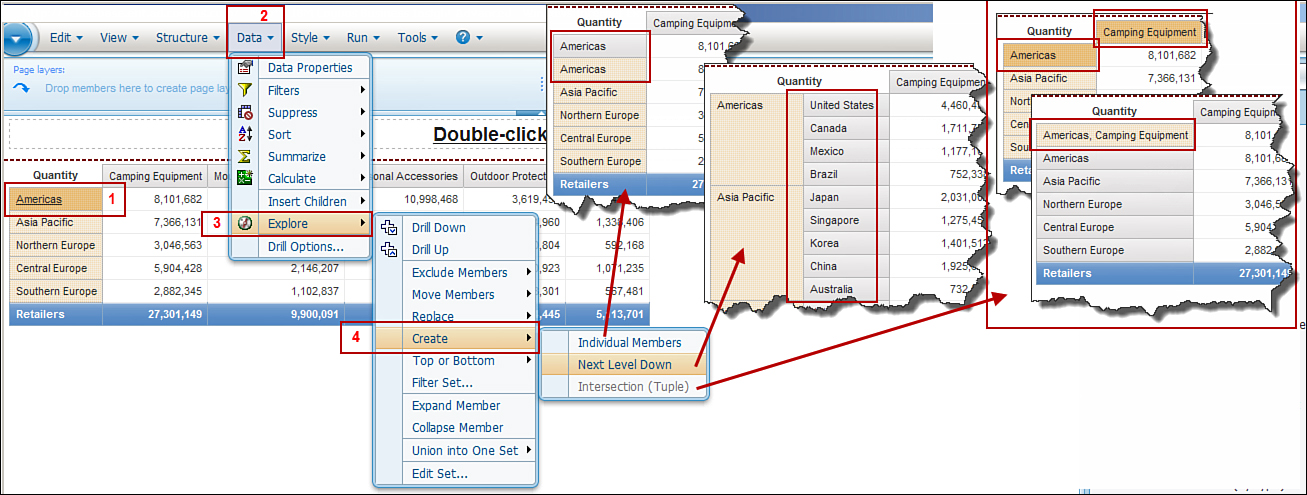
Figure 9.43. Steps to Create – Individual Members, Next Level Down, and Intersection (Tuple).
• Individual Members: Use this option to duplicate individual members separate from the set.
1. Open the SampleOutdoorProductsReport report (if not already open).
2. Click Americas > Data menu > Explore > Create > Individual Members.
3. Undo the change.
• Next Level Down: Use this option to add the child members as a new column. The child members appear as nested within the selected column.
1. Open the SampleOutdoorProductsReport report (if not already open).
2. Click Americas > Data menu > Explore > Create > Next Level Down.
NOTE: The children members (next level down) are nested within the selected column, as shown inFigure 9.43.
3. Undo the change.
• Intersection (Tuple): Use this option to create a row that intersects two data members.
1. Open the SampleOutdoorProductsReport report (if not already open).
2. Click Ctrl+Click Americas and Camping Equipment > Data menu > Explore > Create >Intersection (Tuple).
NOTE: A new row is created for Americas, Camping Equipment, above the Americas row, as shown inFigure 9.43.
3. Undo the change.
• Top or Bottom option enables you to focus the data in the report to what is most important for you, for example, top/best performing or bottom/least performing groups of data. You can choose from the following options:
• Top 3 based on: Select row/column value:
1. Open SampleOutdoorProductsReport report (if not already open).
2. Click Americas > Data menu > Explore > Top or Bottom > Top 3 based on Quantity.
NOTE: The top three retailers are listed in the result that is, Americas, Asia Pacific, and Central Europe, as shown in Figure 9.44.

Figure 9.44. Steps to display Top or Bottom performing data in a report.
3. Undo the change.
• Top 5 based on: Select row/column value. This option works in a similar way as Top 3 based on; select row/column value as illustrated earlier.
• Top 10 based on: Select row/column value. This option works in a similar way as Top 3 based on; select row/column value as illustrated earlier.
• Bottom 3 based on: Select row/column value.
1. Open SampleOutdoorProductsReport report (if not already open).
2. Click Americas > Data menu > Explore > Top or Bottom > Bottom 3 based on Quantity.
NOTE: The bottom three retailers are listed in the result.
3. Undo the change.
• Bottom 5 based on select row/column value. This option works in a similar way as Bottom 3 based on select row/column value as illustrated earlier.
• Bottom 10 based on select row/column value. This option works in a similar way as Bottom 3 based on select row/column value as illustrated earlier.
• Custom use this option to define the top/bottom rule for the following:
Number: Where you need count of people and so on.
Percentage: Where you need to work with the percentage rather than counts for example, top performing regions.
Sum: Where you need to total or sum the values in the column.
In addition, the rightmost box in Figure 9.44 demonstrates that similar functions can be performed using the column values.
• Filter Set...: Use this option to filter members within a set. When you filter members within a set, you remove members from within the set using the filter condition. This option is only applicable to dimensional reports. You can create complex filters using the AND, OR, and NOT operators.
You can filter members within a set using one of the three ways, as shown in Figure 9.45 and described in the list that follows.
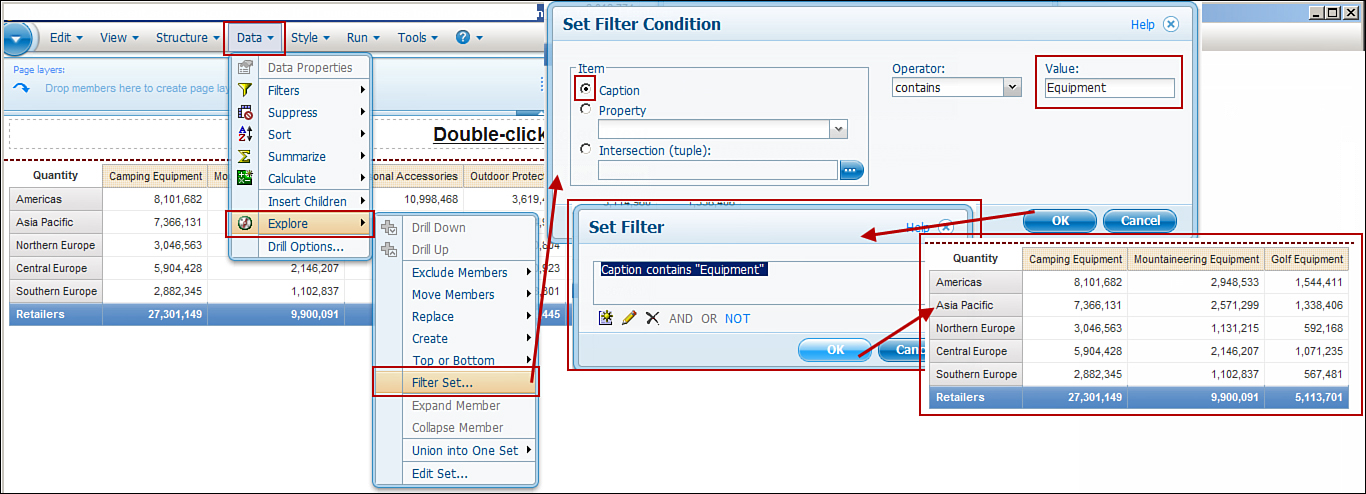
Figure 9.45. Steps to filter members within a set using the Filter Set... option.
• Caption: Use this option to filter by member caption, for example, Product line that contains “Equipment” in its description. This option works with indexed data. If required, work with IBM Cognos BI Administrator to request indexing on additional columns.
1. Open the SampleOutdoorProductsReport report (if not already open).
2. Click the Product line, for example, Camping Equipment.
3. Click the Data menu > Explore > Filter set... > Caption.
4. In the Filter contains clause, type Equipment > click OK.
NOTE: You can use the NOT operator also to create the filter condition. If you create a new condition, the new condition automatically uses AND to join the two conditions.
5. Click OK again.
6. Save the report.
NOTE: The result has only those product lines displayed that have the word Equipment in them, that is, Camping Equipment, Mountaineering Equipment, and Golf Equipment, as shown in Figure 9.45.
• Property: Use this option to filter by descriptive values, for example, organization, employee names, and so on. You can use this for both numeric and string values. This option works with data that is not indexed.
• Intersection (Tuple): Use this option to filter by intersection of members and metrics (tuple).
• Expand Member: Use this option to expand the selected member and add its children as rows below it.
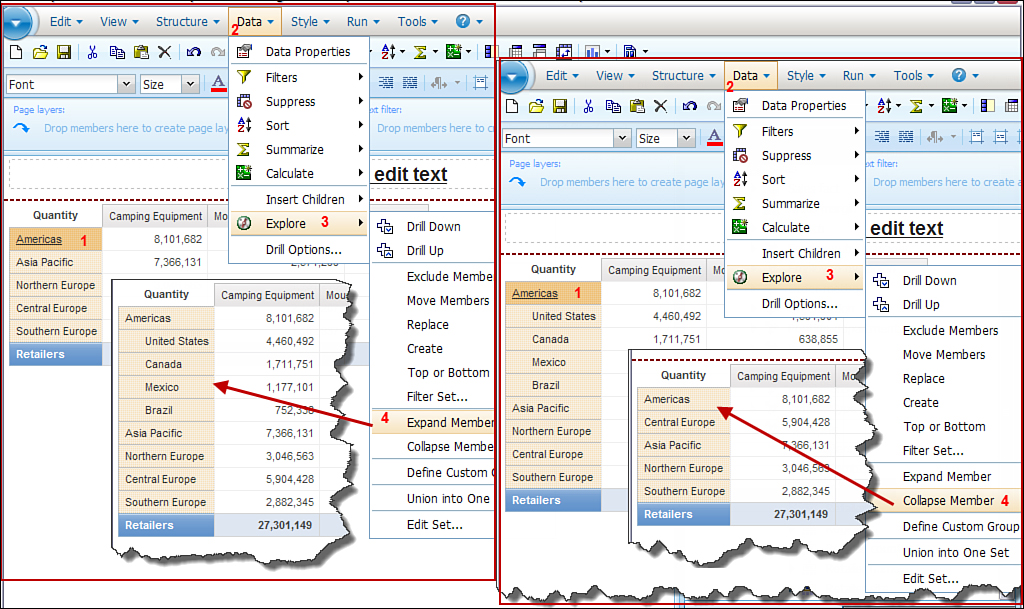
Figure 9.46. Expand Member and Collapse Member options and their respective outputs.
Defining Custom Groups
The Define Custom Group option enables you to group existing data into categories that are meaningful to your business. For example, you may want to create Summer Promotion product categories and to package products in a group that would enhance sales. You can create several such groups and categorize each one, or you can choose to group only certain products together and leave the others as is. Or for the rest of the product lines that are not part of Summer Promotion product, you may want to club them into Other category.
You can create a custom group in a List or Crosstab report. When you create a custom group in a List report, a new column is added with the name you give to the custom group. You can use this column to group or sort data just like any other item in the report. In addition, you may keep the groups you need and delete the ones you do not need.
To create Custom Groups, perform the following steps:
1. Open the SampleOutdoorProductsReport report (if not already open).
2. Click the item you want to create a custom group for selected Product lines, for example, Camping Equipment, as shown in Figure 9.47.
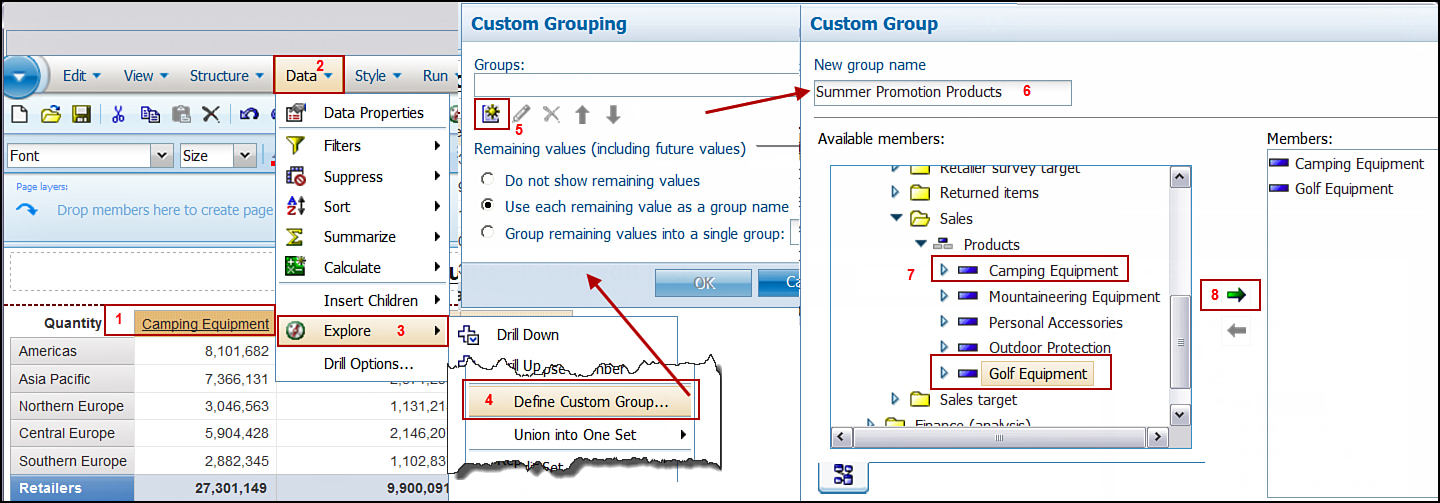
Figure 9.47. Steps to create custom groups.
3. Click the Data menu > Explore > Define Custom Group.
4. Click the New icon (looks like a bicycle gear).
5. In the New group name, type Summer Promotion Products.
6. In the Available members section, navigate to GO Data Warehouse (analysis) > Sales and Marketing (analysis) > Sales > Products.
7. Ctrl+Click Camping Equipment and Golf Equipment, and click the green arrow to move them to the Members box.
8. Click OK.
9. In the Custom Grouping window, keep the default Use each remaining value as a group name.
10. Click OK.
NOTE: In Figure 9.48, Camping Equipment and Golf Equipment have now been grouped together asSummer Promotion Products, whereas Mountaineering Equipment exists by itself.
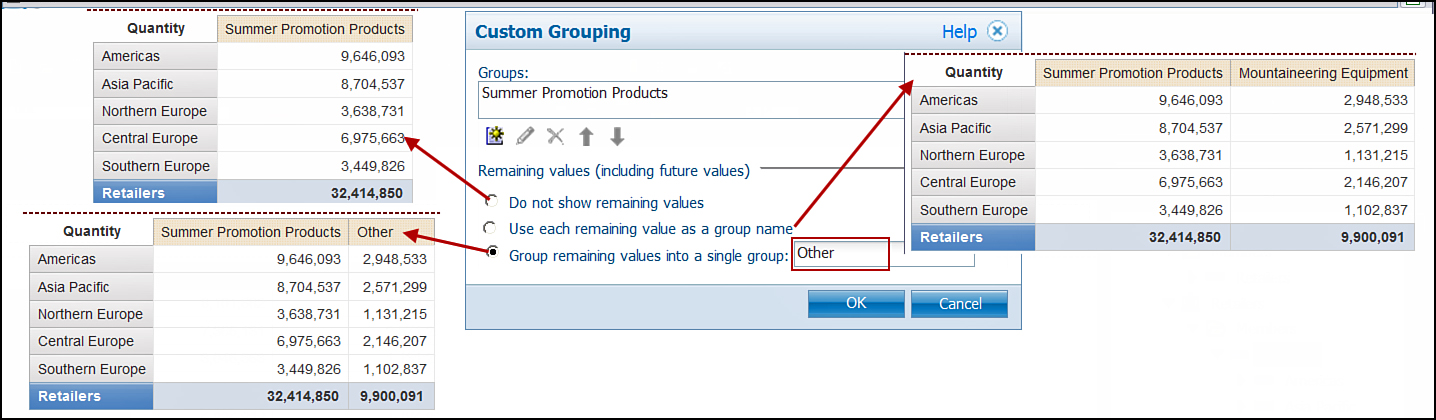
Figure 9.48. Create Custom Group with the three options and their results.
11. Undo the change; you will explore the other two options in the Custom Grouping window, in theRemaining values (including future values) section.
12. Repeat steps 1–7.
13. In the Remaining values (including future values), click the first option—Do Not Show Remaining Values.
NOTE: With this option only, the new custom group you created shows in the result and all the remaining items, for example, Mountaineering Equipment is no longer displayed in the report.
14. Click OK.
15. Undo the change; you will explore the third option in the Custom Grouping window, in theRemaining values (including future values) section.
16. Repeat steps 1–7.
17. In the Remaining values (including future values), click the third option > Group remaining values into a single group > type Other.
NOTE: This option enables you to club all the other items in the report that do not belong to the custom group into another group name you provided for example, Other. If you create a Custom GroupSummer Promotion Products with Camping Equipment and Golf Equipment, only the remaining products will appear under the column Other, as shown in Figure 9.48.
18. Click OK.
Union into One Set
Use the Union into One Set option to work with data from multiple sets by joining the data from these sets into one large set. When bringing the data together from multiple sets, you can choose to remove duplicate entries or keep the duplicates (described in the list that follows), depending on the analysis you are performing, as shown in Figure 9.49.
• Remove Duplicates: Enables you to remove a duplicate set and keep only one copy of the entry in the set.
• Keep Duplicates: Enables you to work with multiple copies (duplicates) of an entry in the set after joining.
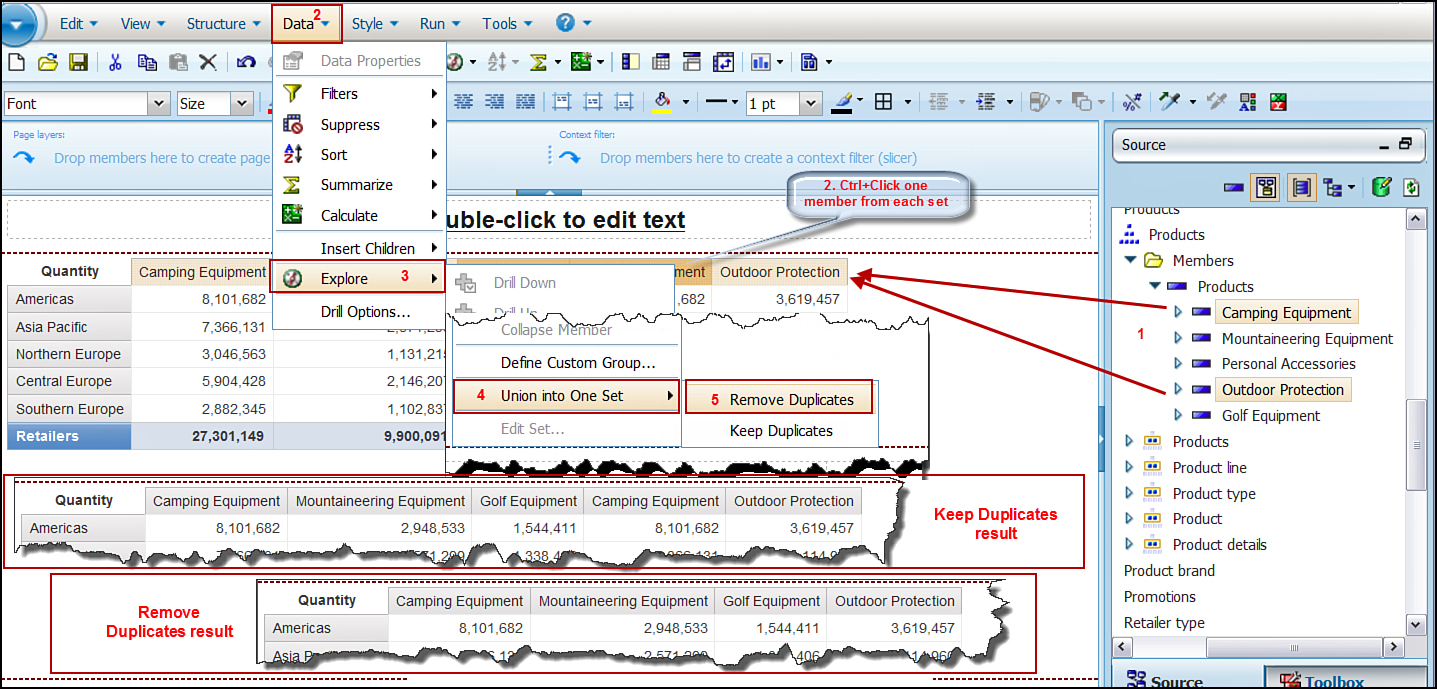
Figure 9.49. Camping Equipment exists twice in Keep Duplicate and once in Remove Duplicates option.
To perform a Union into One Set, do the following:
1. Open the SampleOutdoorProductsReport report (if not already open).
2. From the Insertable Objects pane, expand Products dimension > Products level > Membersfolder.
3. Ctrl+Click Camping Equipment and Outdoor Protection.
4. Drag and drop Camping Equipment and Outdoor Protection next to Golf Equipment, as the rightmost column.
NOTE: There are two sets currently in the report, one composed of Camping Equipment,Mountaineering Equipment, and Golf Equipment and the second composed of Camping Equipmentand Outdoor Protection.
5. Ctrl+Click Golf Equipment (or any member of set 1) and Camping Equipment (set 2).
6. Click the Data menu > Explore > Union into One Set > Keep Duplicates.
NOTE: The two sets have now been combined into one set with Camping Equipment existing twice.
7. Undo the Change.
8. Click the Data menu > Explore > Union into One Set > Remove Duplicates.
NOTE: Camping Equipment now exists only once in the combined set.
9. Undo the change.
Edit Set...
Use the Edit Set... option to view the set definition and modify it if required. It provides a graphical representation of the steps you performed on the set. You can also use the right and left arrow in the Set Definition window to change the order in which these operations should be performed. Figure 9.50shows the high-level steps to Edit Set....
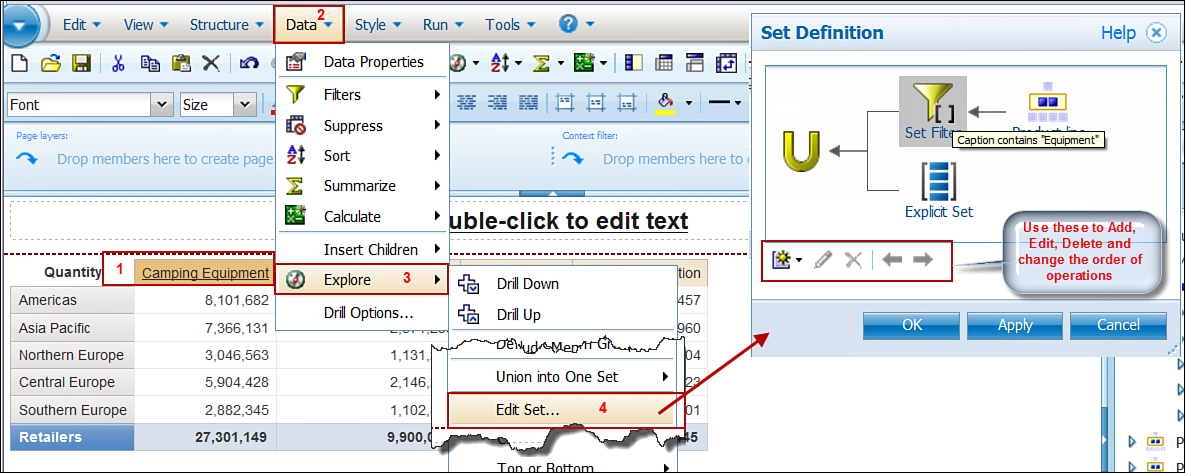
Figure 9.50. Steps to modify a set definition.
The steps to edit a set are as follows:
1. Open the SampleOutdoorProductsReport report (if not already open).
2. Click the Camping Equipment.
3. Click the Data menu > Explore > Edit Set....
4. In the Set Definition window, click any of the operation and click Edit (pencil icon) to modify the filter.
5. Click the New icon (resembles a bicycle gear); click the drop-down.
NOTE: Options Exclude, Move to Top..., Move to Bottom..., Top..., Bottom..., Set Filter..., Expand...,Collapse..., and Custom Grouping... are also available from here.
6. Click Camping Equipment > Data menu > Explore > Edit Set....
7. In the Set Definition window > click the New icon > from the drop-down list, select Custom Grouping....
8. In the Custom Grouping window > click New Group Entry.
9. In the Custom Group window > in the New Name Group box > type Not in Summer Promotion > expand Sales and Marketing (analysis) > Sales > Products > click Golf Equipment > click on right green arrow. (This moves Golf Equipment to the right in the Members box.) > click OK > click OK again > click OK again > click OK again.
NOTE: Golf Equipment is now displayed with column header Not in Summer Promotion.
10. Click Not in Summer Promotion > Data menu > Explore > Edit Set....
11. In the Edit Definition window > click on Custom Grouping > click the right arrow and moveCustom Grouping to the right as the next step.
12. Click OK.
NOTE: The Not in Summer Promotion is no longer displayed in the report.
The preceding exercise illustrates how the Edit Set... enables you to see how the query has been built and enables you to change the sequence in which steps are applied.
Style
This option works similar to applying styles when working with relational reports. Refer to the section “Applying a Conditional Style to Highlight Exception Data in the Report” for how to apply conditional styles.
Run
Run Report options are the same as when working with a relational report. Refer to section “Run Reports” in “Working with Relational Reports.”
Tools
The Tools option provides additional options that enable you to manage the report:
• Auto Correct can be used to request Cognos Workspace Advanced to fix the error. Sometimes there could be an error due to the application being unable to retrieve data; however, if it is unable to fix the issue, switch to Page Design mode, and delete/fix the item.
• Show Specification enables you to work with the report specification. Report Specification is an XML file that gets created when you save the report. You can use the Software Development Kit to make a change that needs to be made in multiple reports to the XML files directly.
• Show Specification (Selection) option shows the report specification XML of the currently selected item.
• Open Report from Clipboard options enable you to open a report specification that was copied to the clipboard.
• Copy Report to Clipboard copies the report specification of the currently opened report to the clipboard.
• Manage External Data... brings up the External Data Wizard and guides you through steps that enable you to use data from a CSV, TXT, XML, or Excel file to report within IBM Cognos BI environment.
• Options... provides features that you can set for your IBM Cognos BI session:
• View provides the following functionalities that you can enable/disable using check boxes, for example, Show startup dialog, Reuse IBM Cognos Viewer window, Resize IBM Cognos Viewer window, Enable animation, Position pane on the right (requires restart), Show rich tooltips (requires restart), and Display report preview. You can also specify the Window startup size by choosing one of the following values from the drop-down list, for example, Screen, Previous, and Browser default. In addition, use the Start page view drop-down list to choose from one of the following values, for example, Design and Preview (default).
• Edit provides the following functionalities that you can enable/disable via check boxes, for example,Automatically populate values list, Enable drill-up and drill-down links, Use chart flyouts in Design View. Drop Replace on Crosstab and Chart Nodes is a drop-down option that you can choose from No replace, Replace edge (default) or Replace node. Double-click Member Action is another drop-down option available to you with following values to choose from: Drill up or Drill down(default), Insert details before, Insert details after, Nest details, Replace with children, Default, andNo action.
• Report enables you to specify a value for Limit on inserted individual children members; the default is 20.
• Advanced enables you to enable/disable the following features via checkboxes: Use operating system clipboard, Allow local file access, Use legacy chart authoring, Disable chart preview in design view, Override 10.x styles with 8.x styles on new reports, and Member display count limit (in source tree). You must type another value to specify the number of members to be displayed in the Source tree, default being 50.
Summarizing Data in a Dimensional Report
Creating summaries when working in the dimensional reporting style is similar to that discussed earlier in the relational reporting style. You can summarize data in your report to Count, Total,Average, Minimum, and Maximum. The option Automatic Summary automatically uses one of the available functions, for example, Count, Total, and so on, depending on how the data is defined in the metadata model. For example, for identifiers and keys the count is more appropriate than the total. However, if this were not defined as such in the model, you can choose the most appropriate option for the report.
After you summarize the data in the report, a row or column summary is added to the report. You can drag and drop the summary row/column to another location in the report or delete it if you do not require it by using the Delete key.
The behavior of the summary functions is identical to those described in relational reporting. Refer to the “Summarizing Report Data” section within the “Working with Relational Style Reports” parent section.
To summarize data, perform the following steps:
1. Click the New icon on the Standard toolbar to create a new report.
NOTE: The package currently in use must be a dimensional package—for example, GO Data Warehouse (analysis).
2. Select Blank from the New report window > click OK.
3. Navigate to the Toolbox tab in the Insertable Objects pane; drag and drop List onto the report area.
4. Navigate to the Source tab in the Insertable Objects pane, drag and drop from Productsdimension > Products hierarchy > Product line level onto the report.
5. Drag and drop from Products dimension > Products hierarchy > Product type level to the right of Product line.
NOTE: Ensure the data in Product line column now repeats for Product Type value.
6. Drag and drop from Sales fact > Quantity to the right of Product.
NOTE: By default the Overall Summary is provided at the end of the report when you drag and drop a numeric value onto your report. You can delete the summary row if you do not want to display it in the report.
7. Click the Bottom link in the page navigation section (bottom left of the report).
NOTE: An Overall Summary row is created for all numeric values in the report.
Group/Ungroup
Use the Group/Ungroup option to remove duplicate data items from a List report. The column you use for grouping automatically moves that column as the leftmost in the report. The next column you group on automatically appears to the right of the first grouped column. However, after the column is grouped, you can move it anywhere in the report. You can specify the order in which the data should be sorted in a grouped report.
You can group multiple columns at the same time by Ctrl+Clicking on the columns you want to group.
For details on how to group/ungroup, refer to the “Group/Ungroup Data in the Report” section discussed earlier in the “Working with Relational Style Reports” parent section.
Inserting Calculations
Use the Insert Calculation option to derive values using existing data, for example, Planned Revenue – Revenue, and so on. Cognos Workspace Advanced supports options that can help you derive simple calculated values. For complex calculations, it is recommended you use Report Studio, which is designed for complex and advanced reporting.
For detail on how to create calculations refer to the “Creating Calculations” section discussed earlier in the “Working with Relational Style Reports” section.
Pivot List to Crosstab
Refer to the “Using the Pivot List to Crosstab Option” section in the parent section “Working with Relational Style Reports” discussed earlier in this chapter.
Section/Unsection
Creating sections in the report enables you to display each data item separately in a List, Crosstab, or Chart. Section is similar to grouping data in a List report. The difference however is that when you section a report using a data item, that data item appears above the List, Crosstab, or Chart as a section header. When you remove the section from the report, the data item is returned back to the List, Crosstab, or Chart. Also, although you can only group data in a List report, you can section a List, Crosstab, and Chart.
When working with a Crosstab, you can create sections using both rows and columns at the same time. When you remove the section in such a scenario, all the data items return to one edge of the Crosstab for the first data item that was selected. You can drag the data items to the location you want them to belong.
In the following example, you build a Crosstab report and section the data by Organization. The purpose of excluding data and removing the summary from the report is to make the report readable and is not mandatory prior to sectioning the data.
To create a section in a report, perform the following steps:
1. Click the New icon on the Standard toolbar to create a new report.
2. In the New window, choose Crosstab report output type.
3. Switch to the View Members Tree option in the Insertable Objects pane.
4. Navigate to GO Data Warehouse (analysis) > Sales and Marketing (analysis) > Sales.
5. Drag and drop Organization to the Rows.
6. Drag and drop Products to Columns.
7. Drag and drop Sales fact > Quantity as Measures.
8. Click GO Accessories > Data menu > Explore > Exclude Members > From Initial Set.
9. Ctrl+Click columns Personal Accessories, Outdoor Protection, and Golf Equipment > Datamenu > Explore > Exclude Members > Current Set.
10. Click the Products column (that has totals); click delete to delete the Summary Column.
11. Click any row value, for example, GO Americas, and click the icon Section/Unsection on the Standard toolbar.
NOTE: The report is now divided by Organization, and each Organization exists as a section header outside of the crosstab, as shown in Figure 9.51.
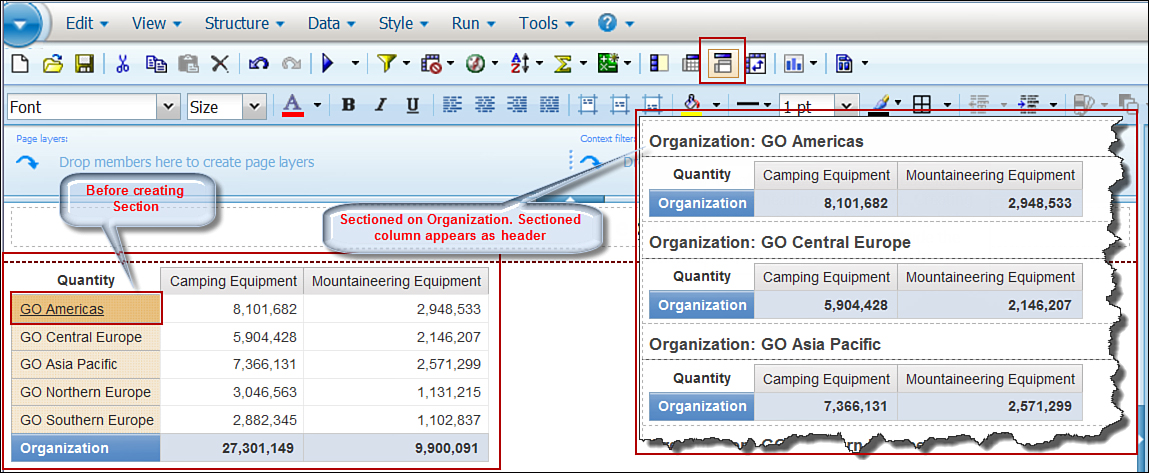
Figure 9.51. Section data in a dimensional report.
12. Click the sectioned column and then click Section/Unsection icon in the Standard toolbar.
NOTE: The Section/Unsection icon is a toggle.
13. Save the report as MySectionCrosstabReport.
Automatically Create Crosstab Headers for Sets
Crosstab headers for sets enable you to understand where the row and column data exists in the hierarchy. To display Crosstab for sets, click the Tools menu > Options > Report tab > select theAutomatically create crosstab headers for sets check box > click OK. This is applicable for dimensional reports only. After you enable this feature, the header labels will be added when new sets are added to the Crosstab, or you can add a new Crosstab to the existing report.
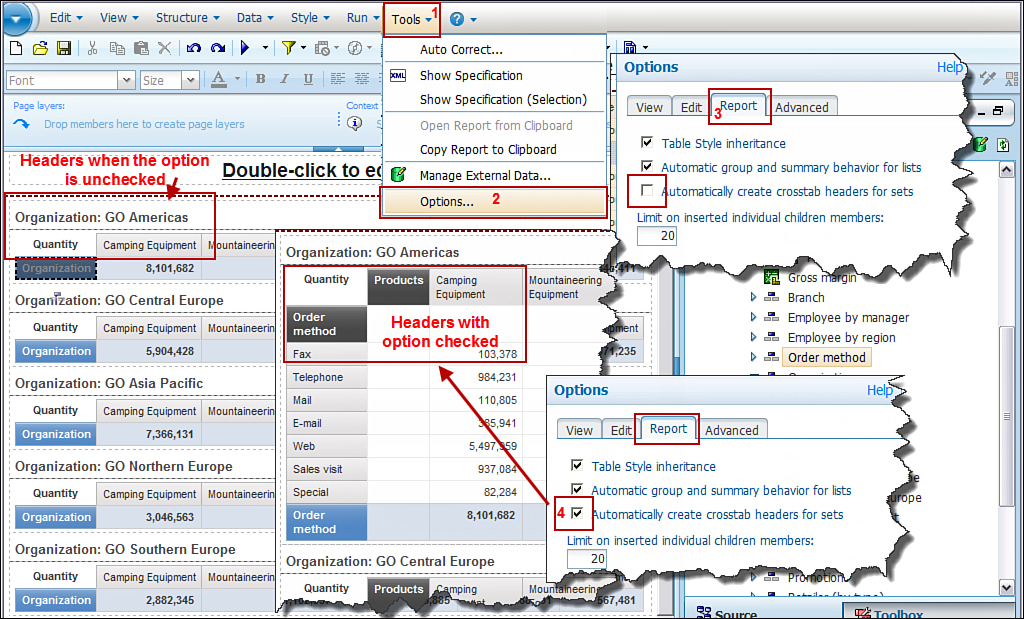
Figure 9.52. Enable option to Automatically create crosstab headers for sets.
1. If not already open, open MySectionCrosstabReport report.
2. Click Tools menu > Options > Report tab > select the Automatically create crosstab headers for sets check box > click OK.
3. From the Source tab, using View Members Tree > drag and drop Order method on top ofOrganization (Rows).
NOTE: An additional row with the label Order Method and a new column Products are added to the report indicating the parent categories of the data items in the row and column.
4. Save the report.
Table Style Inheritance
You can enable the property Table Style inheritance to pass the Table Style when drilling up and down in a dimensional report. If this property is not enabled, any formatting you apply to the parent is not passed to the lower levels on drilling down. If you want to pass the formatting to the lower levels when drilling up/down data, you should enable this property.
The following list of steps guide you on how to enable this property when working with dimensional data. Figure 9.53 shows the high-level steps for this operation.

Figure 9.53. Enable Table Style inheritance.
1. If not already open, open MySectionCrosstabReport report.
2. Click Tools menu > Options...> Report tab > ensure Table Style inheritance check box is not selected.
3. On the Standard Toolbar, click Swap Rows and Columns.
4. Click Camping Equipment cell > Properties pane > Foreground color > click the drop-down > select Blue.
NOTE: The Product line values now appear in blue.
5. Right-click Camping Equipment > Explore > Drill Down.
NOTE: The color for Cooking Gear and other Camping Equipment product types does not appear in blue. The formatting was not applied.
6. Right-click Cooking Gear > Explore > Drill Up.
7. Click Tools menu > Options... > Report tab > select the Table Style inheritance check box.
8. Right-click Camping Equipment > Explore > Drill Down.
NOTE: The Camping Equipment product types, for example, Cooking Gear, now appear in blue, and the formatting is now inherited by the lower levels.
Copying Cognos Workspace Advanced Data to Excel
If you want to copy the data in a Cognos Workspace Advanced to Excel while retaining the formatting, use the Copy Data option on the Edit menu. Figure 9.54 illustrates the high-level steps for how to copy data.
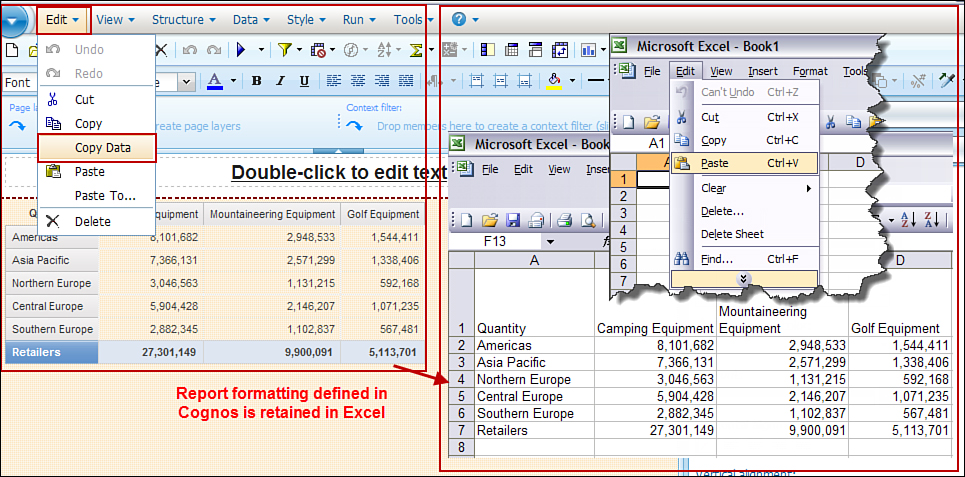
Figure 9.54. Copy Data option to copy data to Excel.
1. If not already open, open the SampleOutdoorProductsReport.
2. Click the Edit Menu > choose Copy Data.
3. Open an Excel file > select Paste.
NOTE: The data from the report is copied and not its XML specification. Select Edit menu > Copy option copies the XML report specification.
Swap Rows and Columns
Refer to the “Swapping Rows and Columns” section in the “Working with Relational Style Reports” parent section, discussed earlier in this chapter.
Insert Chart
Refer to the “Inserting a Chart in Your Report” section in the parent section “Working with Relational Style Reports,” discussed earlier in this chapter.
Page Layout
Refer to the section, “Using the Page Layout Option,” under the parent section “Working with Relational Style Reports,” discussed earlier in this chapter.
Create Page Layers
Page layers enable you to display the value of each member on a different page. This option is only available when working with a dimensional data source. When you drag and drop a member to thePage layer, the report is split into separate pages with each page displaying each child of the member. Drag and drop items from the Insertable Objects pane to the Page layers area to create Page layers. You can create Page layers on items that may or may not exist in the report. For example, in a report that has Retailers, Product line, and Quantity displayed, you can drag and drop Order Method from the Insertable Objects pane to the Page layers. This results in each page displaying Retailers, Product line, and Quantity for each Order Method per page, for example, Fax in one page, E-mail in another. The value for quantity will be filtered accordingly. The value used to create the Page layer displays as the page header, as shown in Figure 9.55.
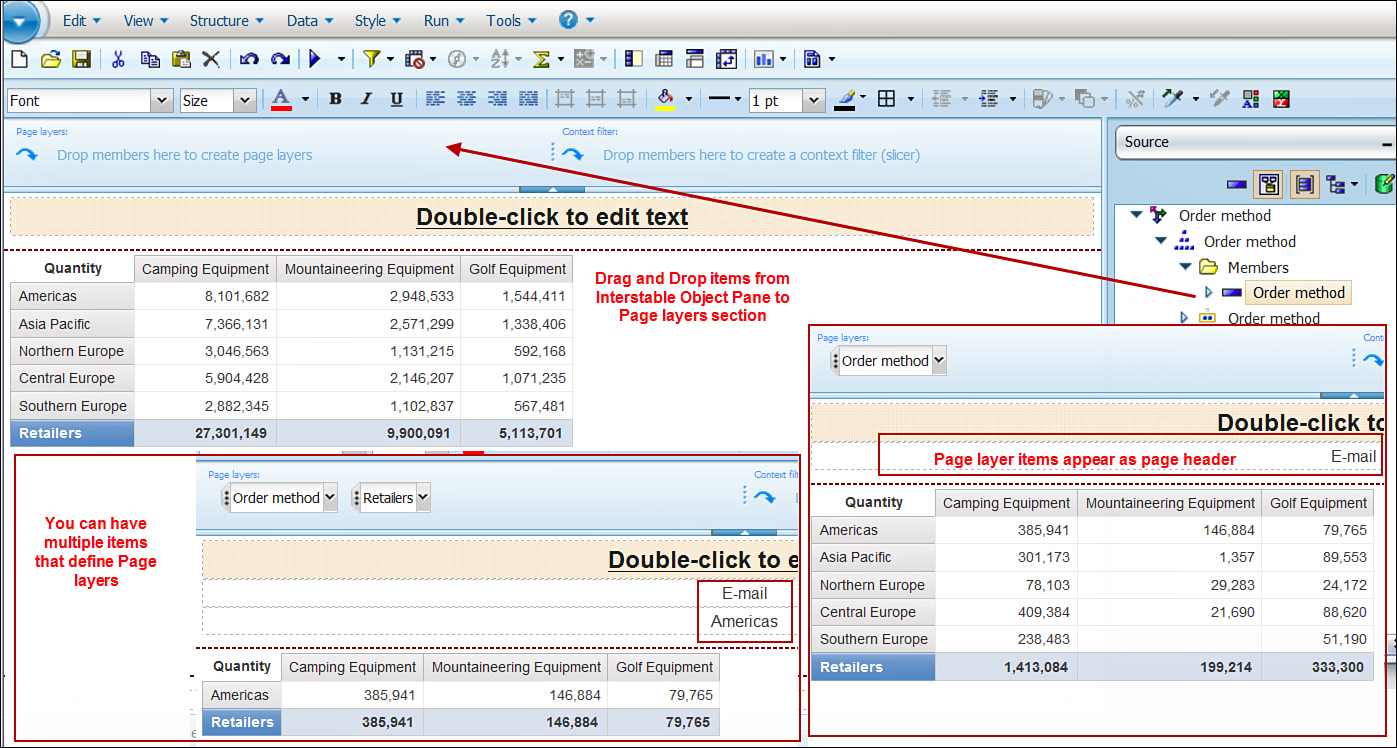
Figure 9.55. Steps to define Page layers in a report.
To create page layers in a report, perform the following steps:
1. In the Insertable Objects pane, navigate to Order Method, and drag and drop Order Methodto the Page layers area.
Note
E-mail now appears as the Page header. Use the Page down link and navigate to the next page; you see that Fax and other Order Methods each now appear on a separate page.
2. From the Insertable Objects pane, drag and drop Retailers to the Page layers area.
WORKING WITH EXTERNAL DATA
You can combine the existing trusted information in your IBM Cognos BI environment with benchmark or survey data, for example, so you may find in the market in the form of Excel (CSV), text (TXT), and so on using the External Data feature.
It is not uncommon that even with an existing BI implementation, business users and advanced business authors often have needs to extend their analyses for a broader perspective by combining existing corporate data with external survey data or benchmark data available to them from external sources. It is also not uncommon that departments may continue to collect data in spreadsheets for their specific needs. With the External Data feature departments, business users, advanced business authors, and others can extend their analysis using data from external files without depending on the IT department for their one-off reports.
To extend your analysis with external file data, you must have some common information between the external data file and corporate data that can define the relationship between the two data sources. Also, data must exist in a compatible form; for example, dates in the external data file must be in the yyyy-mm-dd format.
The key benefits of External Data functionality are as follows:
• Combine trusted corporate data with other information available in the market like benchmark data, survey data, and so on.
• Use values from data in an external file to filter the data from the BI system, and focus on only those relevant for your analysis.
• Reduce dependency on IT by enabling users to work with external data files, for example, Excel. Business users can perform analyses using different sets of data from various files to fulfill each one-off request without going to IT.
• Use data from an external file in a secured BI environment.
• It is wizard-driven and easy to use.
For you to import data from your external data file, you must have been granted the permission Allow External Data capability by your IBM Cognos BI Administrator.
Some key points to remember when working with external data are as follows:
• You can work with Microsoft Excel (.XLS), tab-delimited (.TXT), comma-separated value (.CSV), and XML files to extend your analyses using external data.
• There can be only one external data file per package.
• The default maximum file size that you can import is 2.5 MB, with a maximum of 20,000 rows. This setting can be changed via the Maximum external data file size and Maximum external data row count governors setting in IBM Cognos Framework Manager, by the IBM Cognos Metadata Modeler.
• You can use both relational and dimensional data sources to work with your external data file. If you have a dimensional source, you must first create a List report with all the elements you need for reporting and then link the external data file with the List report. For a relational data source, it is not mandatory to create a List report to link to the external data file.
• When working with a relational data source, you may link the external data file directly to a single Query Subject; however, this restricts the external data to a single dimension. Alternatively, you may want to create a List report using the Cognos package and link the external data file to the report.
• The data in the external file does not get stored in the Cognos content store database. You must ensure that the external data file is available for future runs.
• The data from the external file is cached when the report is first run, and the changes to the data files do not have any impact on the already cached data, that is, the changed data in the file does not automatically show up in the report until you reload Cognos Workspace Advanced.
• If you want to share the report with others, you must either share the file with them individually or save it on a network drive accessible by IBM Cognos BI server.
The high-level steps to work with external data are as follows:
1. Select Data: In this step you must select the external data file you want to import and the data items from the file you want to include for reporting. You may select the check box Allow the server to automatically load the file; with this option checked you are not prompted to provide the file name every time to run the report. In addition, in the section Namespace for the external data, you must provide a name that will be used as the namespace name in the new package. The namespace name provides a unique name to associate with the data items imported. By default, this is the same as the external data filename without extension; however, you can change it to anything else. When you change the default namespace name, you will be prompted to select the external data file every time to run the report. To bypass this you can select the check box Allow server to automatically load the file. This enables the server to automatically load the external data file for reporting. In situations in which the server cannot locate the file automatically, for example, the file is inaccessible by the server and so on, the server prompts for the file location. When you import external data you do not overwrite the existing Cognos content; it is stored separately.
However, if you want others to use the report using their own version of the file, you must clear the check box Allow the server to automatically load file. The users must ensure that their external data file versions have the same columns, data type, and so on, as your original external data file used during import and to create the report. In addition, the report must be saved in Public Folders for others to see the report. If you save it in My Folders, it becomes your private report that no one can see except you. To save in Public Folders you must have appropriate permissions to do so. If you do not have permission to save it in Public Folders, you can work with the IBM Cognos BI Administrator.
2. Data Mapping: When you want to use data from both an external data source and the corporate data available in Cognos, you must define how the data in the two data sources link together. For example, if the external file has Product line survey data, the corporate data must have the Product line defined as well. You see in the upcoming section how to define these relationships. Defining these relationships is key to using the external data correctly for reporting. You can link the data from the external file to a data item in a Query Subject or to an item in an existing Cognos report. When the corporate data you require for reporting exists in more than one Query Subject, you should consider creating a report that brings the data together into one single report from all the relevant Query Subjects. You can then map the data in the external file and the report by defining a relationship based on common data items in the two sources. Use the step-by-step wizard to import the external data file from a computer accessible by IBM Cognos BI server or your computer. You must browse and specify the existing report (or a Query Subject in a relational data source) and create a link using common column between the two. You can have more than one link, if required. The links you create are equi-joins (=) and can use data items or calculations.
3. Data Attributes: You must define the data attributes for external data file items in this step, for example, if the data item is a number, string, and so on. Specify the Data type; if there are numeric data items that you may want to summarize or use as measure in a Crosstab report, ensure that theDefault summary option is set to Sum, Average, Maximum, Minimum, or Count rather thanUnsupported (default). Similarly, you must also specify the Decimal places, for example, 2. The Import process makes an attempt to determine and arrive at a reasonable default value; however, you must carefully review it and ensure it matches your requirement. The items listed are only those that exist in the external data file.
4. Mapping Options: In this step you must specify the cardinality on both sides, for example, external data and report/Query Subject or how the data is linked or related to each other. In the section, Values in data source, select the most appropriate radio button for choices All values are unique or Some values exist more than once. If the data in the file is unique and not repeated, you should choose the first option, All values are unique (1:1). If there is repeated data in the external file, for example, employees in the same department will have a repeated department number for each of them. If your situation is such, you must use the second option Some values exist more than once (1: n). Figure 9.56 illustrates the one-to-many relationship between Department and Employee tables.
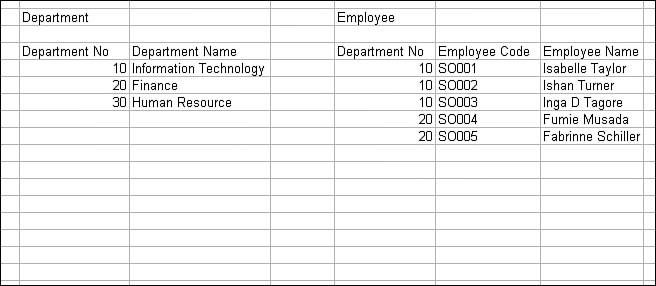
Figure 9.56. One-to-Many relationship between Department and Employee tables.
In the section Values in report results, select the option that matches your reporting requirement. You can choose from one of the two radio button options, Exclude rows with missing values and Include rows with missing values. The first option results in an inner-join where only those rows of data display for which both the data sources have values. The second option, Include rows with missing values, creates an outer join that shows data in the report even though one of the data sources does not have related data. For example, Figure 9.57 in the next section demonstrates that the Product data in the external file and the enterprise data source both have unique, nonrepeated values for Budget Year, Product line, and Product type, that is, (1:1). In this case rows with matching values display only.
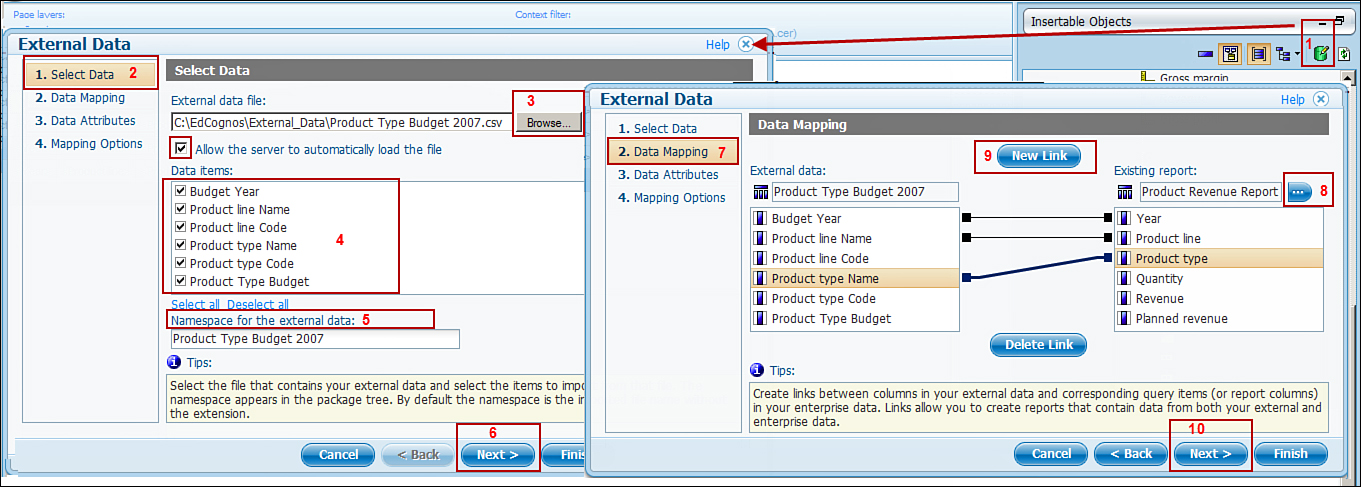
Figure 9.57. Define data selection and data mapping for the external data.
You should understand the data in the external data file and how it relates to the enterprise data. If you are not familiar, take the time to review the same. The options you choose here guide the data you see in the report.
Publishing the Package
After data has been imported from the external data file, you should publish the package to make it available for use in the IBM Cognos BI environment for reporting. After the data is available in IBM Cognos BI environment, it is secured using the existing security in your IBM Cognos BI environment.
By default, the published package has the same name as the package you used to create the report or of the Query Subject with the term External Data appended to it at the end, for example, GO Data Warehouse (analysis) External Data. The imported external data package does not overwrite the existing package. The new External Data package contains the original package and the new external data along with any links or relationships defined between the two (if any). By default the External Data package is published to My Folders; however, you can change the location. You can also change the name of the package at this time, if required.
After publishing the package, notice in the Insertable Objects metadata tree there exists two main namespaces:
• Namespace that holds the result of join between the external data file and enterprise data. It has the name that you gave in the Select Data step of the External Data File Wizard, for example, Product Type Budget 2007.
• If you created a link to a Query Subject, you can see that the new namespace contains the items you selected from the external data file.
• The second namespace is the original package name used to create the List report or uses the relational query subject, for example, go_data_warehouse.
A key point to remember is you should build the report using data items from the namespace that has data joined from the external file and the enterprise package, for example, Product Type Budget 2007. If you try to mix data from both the namespaces, you get cross join errors. If you do need to work with data from both the namespaces, you should link the external data file to the query subject in the current package instead of the report. Other techniques like master-detail relationships can also be used to work around the cross join error.
When you join the external data file to a report instead of the relational query subject, you can see that a data item for example, Quantity, Revenue, and Planned Revenue, that are measures in the Sales fact query subject, appear as a data item in the report rather than a measure. As a result you cannot perform functions like aggregation and rollup by default. To use these data items as a measure in a Crosstab or Chart report, you should change the Rollup Aggregation Function property of these data items, for example, Quantity, Revenue, and Planned Revenue, as Total, in Report Studio. Alternatively, you can change the data item expression, for example, cast it as an integer.
Steps to Creating an External Data Package
You can use data from dimensional package GO Data Warehouse (analysis) and the external fileProduct Budget 2007.csv that contains some what-if budget data that you want to use to extend your analysis of Products in budget year 2007. You can either create this file using the file format provided in Appendix A or use another Excel file provided with Cognos samples in the Cognos install location\...\webcontent\samples\datasources\other. If you use another file, you must ensure that the report has data items you can use to link the report and the external file.
Because the data source is a dimensional package, you first create a List report, Product Revenue 2007 using the dimensional GO Data Warehouse (analysis) package and then join this report with the data in the external data file. Figure 9.57 illustrates the steps to be performed for Select Data and Data Mapping tasks when importing data from an external file and mapping it to an existing Cognos report.
1. In IBM Cognos Connection, click Launch > Cognos Workspace Advanced.
2. In the Select a Package window, select the package GO Data Warehouse (analysis).
3. Select Create new.
4. In the New window, select List report.
5. In Cognos Workspace Advanced, from the Insertable Objects pane, drag and drop the following items to the report:
• Sales and Marketing (analysis) > Sales > Time > Time > Year
• Sales and Marketing (analysis) > Sales > Products > Products > Product line
• Sales and Marketing (analysis) > Sales > Products > Products > Product type
• Sales and Marketing (analysis) > Sales > Sales fact > Quantity
• Sales and Marketing (analysis) > Sales > Sales fact > Revenue
• Sales and Marketing (analysis) > Sales > Sales fact > Planned revenue
6. Save the report as Product Revenue Report.
7. Click the Manage External Data icon (marked as 1 in Figure 9.57), in the Insertable Objects pane.
NOTE: You will be presented with the External Data window. There are four steps listed; you must follow each one in sequence.
8. In the first step, Select Data, via the Browse ... button; then browse to directory where the external data file is located, for example, C:\EdCognos\External Data\Product Type Budget 2007.csv.
NOTE: There are sample .CSV files available with IBM Cognos BI v10.x install in the Cognos Install location \..samples\datasources\other directory, as shown in Figure 9.57.
9. Ensure only the columns you need for reporting are checked. (By default all are selected.)
10. Proceed with the default Namespace for the external data value. (Optionally, you can change it if you want.)
11. Click Next.
12. You are now on Step 2 – Data Mapping, in the Existing report section > click the ellipses, and locate the Product Revenue Report you created earlier (refer to Figure 9.57).
NOTE: In case the data source is relational rather than dimensional, the browser provides you the option Choose Query Subject... and Choose Report... options in the Existing Query Subject/Report section. You may choose the appropriate one for your situation. However, in the example because the data source is dimensional, you can work only with report in the Existing Report Section.
13. Click Open.
NOTE: The data items in the report now display in the box below.
14. Click the New Link button, and join the following:
NOTE: You must click on the New Link button for each new link you need to create. When you create another new link, by default it is shows up for the first item in the list. Click the item on each side to move it to where you need it to be. It is not important for the column names in the two data sources to match; however, the data in the columns being linked must match.
• Product Type Budget 2007 > Budget Year with Product Revenue Report > Year
• Product Type Budget 2007 > Product line name with Product Revenue Report > Product line. (Click Product line name and Product line to move the link.)
• Product Type Budget 2007 > Product type with Product Revenue Report > Product type. (Click Product type name and Product type to move the link.)
15. Click Next.
16. You are now on Step 3 – Data Attributes of the External Data import process. Click Product Type Budget, if not already determined as Integer; click the drop-down for Data type and change it toInteger, as shown in Figure 9.58.
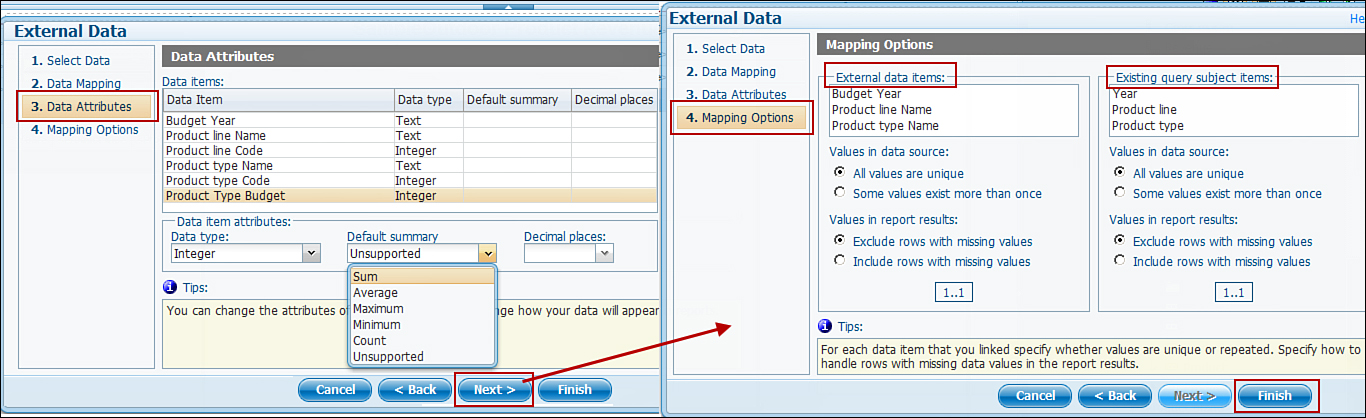
Figure 9.58. Define Data Attributes and Mapping options for the external data.
17. Click the Default Summary drop-down list and choose Sum.
NOTE: You must review each attribute in the Data item attributes section for example, Data type,Default Summary, and Decimal Places. You must change each one as required.
18. Click Next.
19. You are now on Step 4 – Mapping options; proceed with the default because both the files have unique values.
NOTE: If either of the data source has a repeated value, you must change the selection to Some values exist more than once on that side. In addition, by default the join is an equi-join and does not take into account missing values; if you want the data to display for missing values, you must change selection to Include rows with missing values on that side(s).
20. Click Finish.
NOTE: From the Manage External Data window, you can change the name of the Namespace for the external data by clicking the Edit (pencil) icon, or you can change the location where the package will be published by clicking the ellipses.
You are now ready to publish the package. Do not close the window; you need it for the next section.
Steps to Publishing a Package
Now that you have completed the import process, you can publish the external data to the Cognos portal. After the package is published to Cognos Connection, you can use it to build reports. Figure 9.59illustrates the steps to publish the package, the published package, and namespace with external data. The list that follows provides detailed steps for publishing a package.
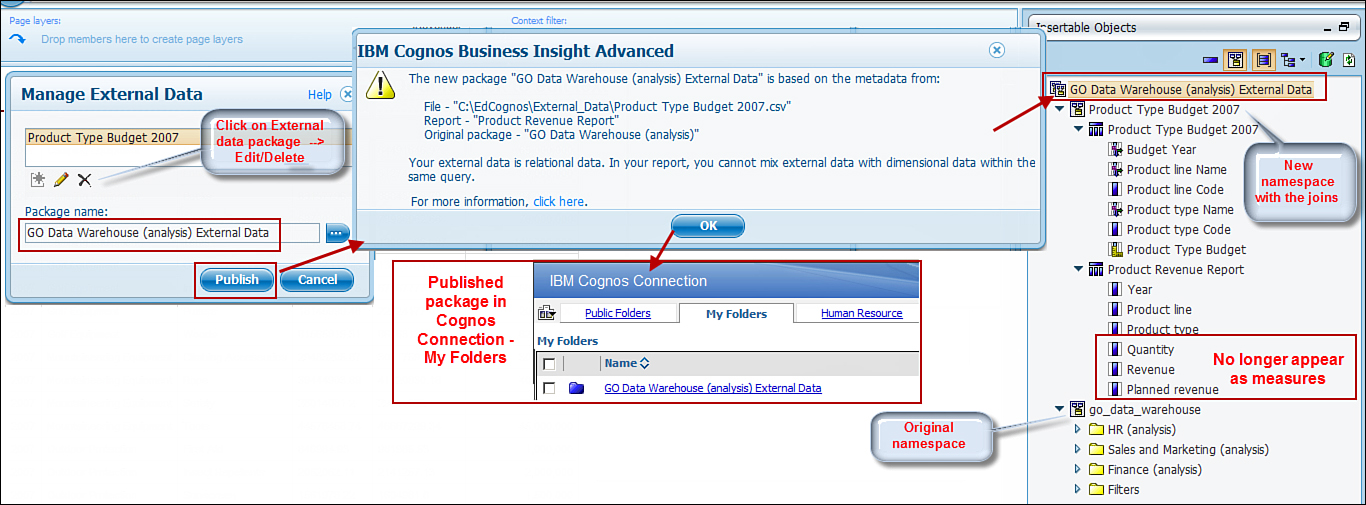
Figure 9.59. Steps to publish the package and the published package contents (on the right).
1. Ensure the correct package is selected; you can optionally change it via the ellipses.
3. Review the information in the IBM Cognos Cognos Workspace Advanced window; then click OK.
4. Click OK.
NOTE: In the Insertable Objects pane, the new external data package you published is available, for example, GO Data Warehouse (analysis) External Data. The package has two namespaces, that is,Product Type Budget 2007 and go_data_warehouse (original package used to create the List report for the joins). Expand the namespace Product Type Budget 2007; it has two query subjects, that is,Product Type Budget 2007 and Product Revenue Report (refer to Figure 9.59). Expand each one, and you see that the items you selected from the external data file during import and the report items are available in each. You can now use these items to build your report that brings together the external data file information and the enterprise data. Remember, trying to combine data from the external data package and the original package results in cross-join errors until you link the two.
Creating a New Report Using External Data Package
Now that you have imported the data from an external file and published the package, you are ready to create a report that uses corporate data along with the external data you imported. If you modify the external data file, you must republish the package because the changes are not automatically reflected in the Cognos portal.
To create a new report using an external data package, perform the following steps:
1. In Cognos Workspace Advanced, click New icon on the Standard toolbar to create a new report.
2. Choose List from the New window to create a List report.
3. Drag and drop the following items from the Product Type Budget 2007 namespace:
• Product Revenue Report query subject > Year
• Product Revenue Report query subject > Product line
• Product Revenue Report query subject > Product type
• Product Revenue Report query subject > Revenue
• Product Revenue Report query subject > Planned Revenue
• Product Type Budget 2007 query subject > Product Type Budget
4. Run the report via the Run option on the Standard toolbar.
5. Save the report as Product Revenue Report 2007.
You have now created a report using external data file data and enterprise data.
Editing External Data
You can modify the external data file to change the import columns, data mapping links, data attributes, or the mapping options.
You can edit the file from the Tools menu > Manage External Data > select the external data file to edit > click the Edit button (pencil) > make the edits > click OK > Publish.
Deleting External Data
You can delete the external data file from within the package if it is no longer needed for reporting. You can delete it from the Tools menu > Manage External Data > select the data package to delete >Delete > Publish.
Lineage Information for Data Items
Refer to the “Lineage” section within the parent section “Working with Relational Style Reports,” discussed earlier in this chapter.
Drill-Through Options
Drill-Through reports provide additional information to support your analysis. For example, you might be looking at the total sales made in Americas; however, you want to find out who is making the most sales or what is contributing to these numbers or other related detailed information. You can drill through to another report that provides the details on the summaries in the current report.
If you require the report to be available as a drill-through source, you should select the check boxAllow this report to be a package-based drill-through source.
FINANCIAL REPORTING
Use the Financial Reporting option to create financial statement-style reports. If you used IBM Cognos Report Studio Express, similar options are available to you to create a financial statement-style report, as shown in Figure 9.60.
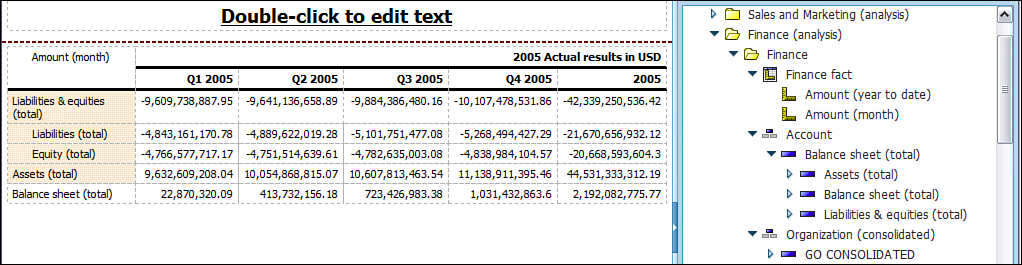
Figure 9.60. Create a financial statement-style report.
You must use the Financial template when you launch Cognos Workspace Advanced.
To create a financial statement-style report, perform the following steps:
1. Click the New icon on the Standard toolbar to create a new report.
2. Ensure that the Package selected is GO Data Warehouse (analysis). If not click the ellipses and open it from the Public Folders > Samples > Models > GO Data Warehouse (analysis).
NOTE: If you do not find the package in this location, consult your IBM Cognos BI Administrator for the location of the package.
3. In the New report window, choose the Financial report template.
4. Click OK.
5. Switch to View Members View in the Insertable Objects pane (if not already selected).
6. Navigate to GO Data Warehouse (analysis) > Finance (analysis) > Account > drag and dropBalance Sheet (Total) to Rows.
7. Navigate to Finance fact > drag and drop Amount (month) to Measures.
8. Navigate to Submission > drag and drop 2005 Actual results in USD to Columns.
9. Navigate to Time > 2005 and nest it under 2005 Actual results in USD column.
10. Click on the column Unspecified 2005 > Data menu > Explore > Exclude Members >From Current Set.
11. Click anywhere in the Measures area > select Ancestor (in Properties pane) > choose Crosstab Fact Cells.
NOTE: Alternatively, you can right-click the measure and choose the Select Fact Cells option. Doing this selects all the fact cells in the measures area; any properties you apply now are applied to all the cells. If you do not want to apply the change to all the cells, individually select the ones you need or Ctrl+Click to pick your choices.
12. Maximize the Properties pane (in not already maximized); click the ellipses for Data format > choose Currency for Format type > click the drop-down for Currency (in Properties section) and choose $USD (United States of America, dollar).
NOTE: To undo the changes you made in this window and start over again, click the Reset button at the bottom of the Data Format window.
13. Click OK.
NOTE: The currency format is now applied to all the columns in the report.
14. Click Balance sheet (total) > Data menu > Explore > Expand Member.
NOTE: After you expand Balances sheet (total), the child entries are displayed showing the rollups values, for example, Assets (total) and Liabilities & equities (total). You already have these two values displayed in the report; you can remove the rows you do not need via Data menu > Explore >Exclude Members > From Current Set.
WORKING WITH CHARTS
Charts are commonly used to display data graphically to highlight trends, comparisons, and relationships. The chart type you choose depends on your requirements and audience; there isn’t one right type of chart. Commonly used charts are briefly discussed in the section “Chart Types.”
Using the chart user interface, you can customize and format chart objects like the title, axes, legend, and so on. Cognos Workspace Advanced enables you to easily switch from one chart type to another to gain a broader perspective of the data analyzed.
If you are a legacy IBM Cognos 8.x user and want to continue working with IBM Cognos Report Studio reports authored using charts created in or use the legacy chart technology in Cognos Workspace Advanced, enable the option Use legacy chart authoring from Tools menu > Options... > Advanced tab > Use legacy chart authoring. You can also convert a legacy chart to a new default chart available in IBM Cognos v10.x.
Chart Types
IBM Cognos Cognos Workspace Advanced enables you to work with a variety of chart types for a diverse audience. You can create a chart as a column, bar, line chart, and so on and switch the chart type easily to get another perspective of the same data.
To create the most value from charts, you must know your audience because some charts are more commonly used in certain business scenarios than others. Some of the commonly used chart types that are supported in Cognos Workspace Advanced are discussed in this section.
• Column Charts are suited for comparing data or displaying trends over time. They use vertical data markers to compare individual values.
• Line Charts are a suitable choice to show trends over time that compare many data series. It plots data at regular points connected by lines.
• Pie Charts are commonly used to highlight proportions. They use segments of a circle to show the relationship between the parts of the whole. They are used to plot a single data series. If your requirement is to plot multiple data series, you must use a 100 percent stacked chart instead. If you use a PDF or HTML report, you must note that a maximum of 16 pie or gauge charts can be displayed. To see more than 16, run the report in a Microsoft Excel spreadsheet software Single Sheet format.
• Bar Charts are commonly used to show trends over time and plot many data series. They use horizontal data markers to compare individual values.
• Area Charts are commonly used when there is a need to emphasize the magnitude of change over time. You can also use stacked area charts to show the relationship of parts to the whole. Area charts are similar to line charts; the difference is that the areas below the lines are filled with colors or patterns.
Area charts may not be the right choice to display multiple data series because the chances are that the lower area values get covered by larger area values. A stacked area chart instead may be a better alternative in this situation.
• Point Charts show quantitative data in an uncluttered manner. They use multiple points to plot data along an ordinal axis. Point charts are similar to line charts without the lines; they display only the data points.
• Combination Charts are commonly used to highlight relationships between different data series. It uses combinations of columns, areas, and lines within one chart to plot multiple data series. This enables you to choose the display for each data item using the chart type you want to use to represent the data.
• Scatter Charts are commonly used to explore correlations between different sets of data. They use data points to plot two measures anywhere along a scale, not only at regular tick marks.
• Bubble Charts are commonly used to present financial data. They use data points and bubbles to plot measures anywhere along a scale. The size of the bubble represents a third measure. Bubble charts are not supported for Microsoft Excel output.
• Bullet Charts are similar to bar charts and are commonly used in executive dashboards. They are used to compare a specific measure (the bullet) to a targeted measure (the target). They relate compared measures against colored regions in the background that provide additional qualitative measurements. You can build bullet charts as horizontal or vertical. To build a bullet chart, you must specify a bullet measure, a target measure (from zero to five colored regions along the numeric scale that provides information about the featured measures’ qualitative state), a label that identifies the measures, and a numeric scale.
• Gauge Charts are commonly used to display information as reading on a dial using a needle and are ideal for displaying small number of variables using multiple needles on a single gauge or as multiple gauges. You can have more than one gauge in a gauge chart, for example, you can add multiple items in the needle area of the gauge chart and display a needle for each item added to the needle area. Gauge charts are also referred to as dial charts or speedometer charts and are frequently used in executive dashboards to display key performance metrics or business indicators. A gauge chart typically consists of a gauge axis that displays the data range, a needle, and a center pivot point. Reports in PDF and HTML are limited to a maximum of 16 pies or gauges and are not supported for Microsoft Excel output.
• Pareto Charts are commonly used for quality control data that highlights the primary cause of problems. They are useful to improve processes by identifying primary causes of an event and rank categories from the most frequent to least frequent. Pareto charts include a cumulation line that displays the percentage of the accumulated total of all columns or bars. You can also use Pareto charts to create before and after comparisons of Pareto charts to highlight the impact of corrective actions. Pareto charts are not supported for Microsoft Excel output.
• Progressive Column Charts are also commonly known as waterfall charts. They resemble stacked charts with each segment of a single stack displaced vertically from the next segment and are useful to show the contribution of an individual segment to the whole. Progressive Column charts are not supported for Microsoft Excel output.
• Quadrant Charts are useful for plotting data that contains three measures using an x-axis, a y-axis and a bubble size that represents the value of the third measure. They look like bubble charts with a background that is divided into four equal sections. These are commonly used where data in presented in quadrants, for example, a SWOT (strengths, weaknesses, opportunities, and threats) analysis. By default the chart uses colored regions; however, legacy quadrant charts use baselines to create the quadrants. You can change the size of the quadrants.
• Marimekko Charts are 100 percent stacked charts where the width of a column is proportional to the total of the column’s values. Also, individual segment height is a percentage of the respective column total value.
• Radar Charts are commonly used where multiple axes are integrated into a single radial figure. For each figure the data is plotted against a separate axis that starts at the center of the chart.
• Win-loss Chart is a microchart in which the value of each column is either 1 or –1, denoting win or loss. The chart uses two measures (the default and the win-loss measure) and no series. The win-loss measure can be any measure or a calculation.
• Polar Charts are commonly used to display scientific data. They are circular charts and use values and angles to show information as polar coordinates. You can specify a default measure to provide context to a calculated measure in the chart.
Chart Objects
This section highlights the various chart objects you can use to build and enhance a chart. Figure 9.61shows the different chart objects and drop zones. The chart objects are described further in the list that follows.
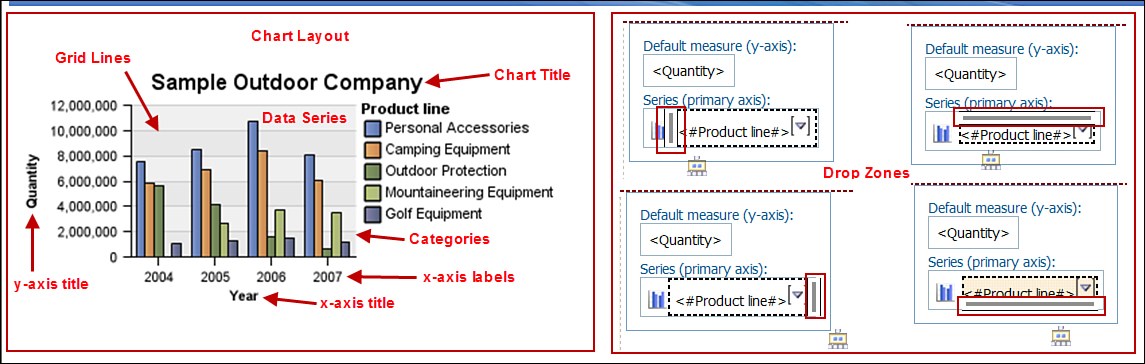
Figure 9.61. Chart objects and different drop zones when nesting data in the chart.
• Data series refers to a group of related data points plotted in the chart. The data series is explained in the legend, and each series is displayed in a different color or pattern. Depending on the chart type, you may have one or more data series in the chart. Pie charts can have only one data series.
• Categories are plotted on the x-axis and display groups of related data from the data series. You can display categories of multiple data series using clustered and stacked data markers.
• Axes are lines on the chart that provide reference for measurement and comparison. The y-axis or the primary axis refers to measures of quantitative data. Charts can have more than one primary axis.
The x-axis or the category axis is used to plot qualitative data. It is typically horizontal with exception to bar charts.
Some chart types, for example, Bullet and Quadrant, enable you to plot a quantitative values along the x-axis. For more information refer to the section “Chart Types.”
The z-axis is the vertical axis in a 3-D chart.
• Legend is key to the patterns or colors assigned to the data series or categories in the chart. Use theProperties pane to change the location of the legend. In addition, you can provide a border for the legend, if required.
• Columns, Lines and Areas are used in the charts as visual representations of data points used by a chart.
Use formats, axis titles, notes, and legends to provide additional information on the charts. You can add data, text, or calculations to the legend and axis titles.
Creating a Chart
You can create a chart by either selecting a Chart when creating a new report or drag and drop a Chart object from the Toolbox or from the Insert Chart option on the Standard toolbar.
When you convert a Crosstab to a chart type, the work area displays both a Chart and the Crosstab report. At this time the data in the two is synchronized. However, if you drag and drop another value to the chart or Crosstab row/column, the change is reflected only in the Chart or Crosstab where you dropped the item.
To create charts you add data items to the chart objects, for example, to measures, series, and categories. At least one data item is required for the categories for column charts, one item to define the series, and one item to define the measures. The chart objects required to build a chart depends upon the chart type you work with. For example, a column chart requires either a value for the series or categories but does not require both. You can drag and drop items from the Source tab onto the chart object location, for example, categories, series, or measure, on the chart itself. In addition, you can use the Properties tab to define the property you want to apply to the chart objects.
Similar to nesting rows and columns in a report, you can nest data in the report by adding data items to charts as parents, children, or peers (union) of existing data items in the chart. To nest items in a chart, you can drag and drop data items in the chart drop zones (appear as three blinking lines). Depending on where you drop, that is, left of the existing item, right, top, or bottom, defines its relationship to the existing item as parent, child, or peer (refer to Figure 9.61). You can drop multiple items on both the vertical and horizontal axis of a chart, even though the additional drop zone may be only visible for the vertical axis. You may drop items in both horizontal and vertical axis to create peer union between items.
To create a chart, perform the following steps:
1. Click the New icon on the Standard toolbar to create a new report.
2. Ensure the package GO Data Warehouse (analysis) is selected.
3. Click Chart from the New window to select the Chart output type. Click OK.
4. From the Insert Chart window, choose Column > Clustered Column. Click OK.
5. Click the blank chart in the work area; you will notice location for Default measure (y-axis), Series (primary axis) and Categories (x-axis).
6. In the Source tab View Metadata Tree option > navigate to GO Data Warehouse (analysis) >Sales and Marketing (analysis) > Sales > Sales fact > drag and drop Quantity as Default Measure, as shown in Figure 9.62.

Figure 9.62. Sorted and Nested data in a chart report.
7. Navigate to GO Data Warehouse (analysis) > Sales and Marketing (analysis) > Sales > Products > drag and drop Product line as Series.
8. Click <#Product line#> > Click Sort icon on the Standard Toolbar > Edit Set Sorting... > choose Descending for Sort type > Intersection (Tuple) for Sort by > click the ellipses > expand folder Sales and Marketing (analysis) > Sales > Sales fact > Quantity > click the green arrowto move the selection to Intersection members and measures box (on right) > click OK > click OKagain.
NOTE: The bars are now arranged in descending order.
9. Click the chart > maximize the Properties pane > click No data contents > In the No data Contents window for Specified text option > type No Data Available for this selection > clickOK.
10. In the Properties pane > click on Title > type Sales by Product Line in the Chart Titlewindow > click OK.
11. In the Properties pane > click Legend > Choose Bottom Left > click OK.
NOTE: Examine the Legend now moved to the bottom left of the chart. You can place the legend in a different area other than the default.
12. Undo the change.
13. In the Properties pane > click Padding > type 20 in the left box > click OK.
14. In the Properties pane > click Name > type Sales by Product Line > click OK.
15. In the Properties pane > click Notes > click New icon > type Data has been Reviewed and Updated by the Sales Team > click Position (in Properties for Notes) > choose Bottom for Position > for Anchor choose Relative to Chart body > click OK.
16. In the Properties pane for the chart > click Border > click Apply All Borders (with all solid lines in the Preview section) > click OK.
17. Navigate to the Source tab, drag and drop Time > Year under <#Product line#> as Series.
NOTE: Ensure you drop the Year in the correct drop zone. Drop it only when you see three bar horizontal lines under Product line.
Creating a Dashboard Report
This section takes you through steps to create a dashboard report. Figure 9.63 shows how to create a dashboard using the concepts covered in this chapter. The following steps guide you through the process to format the content in a workspace when creating a dashboard or a complex report.
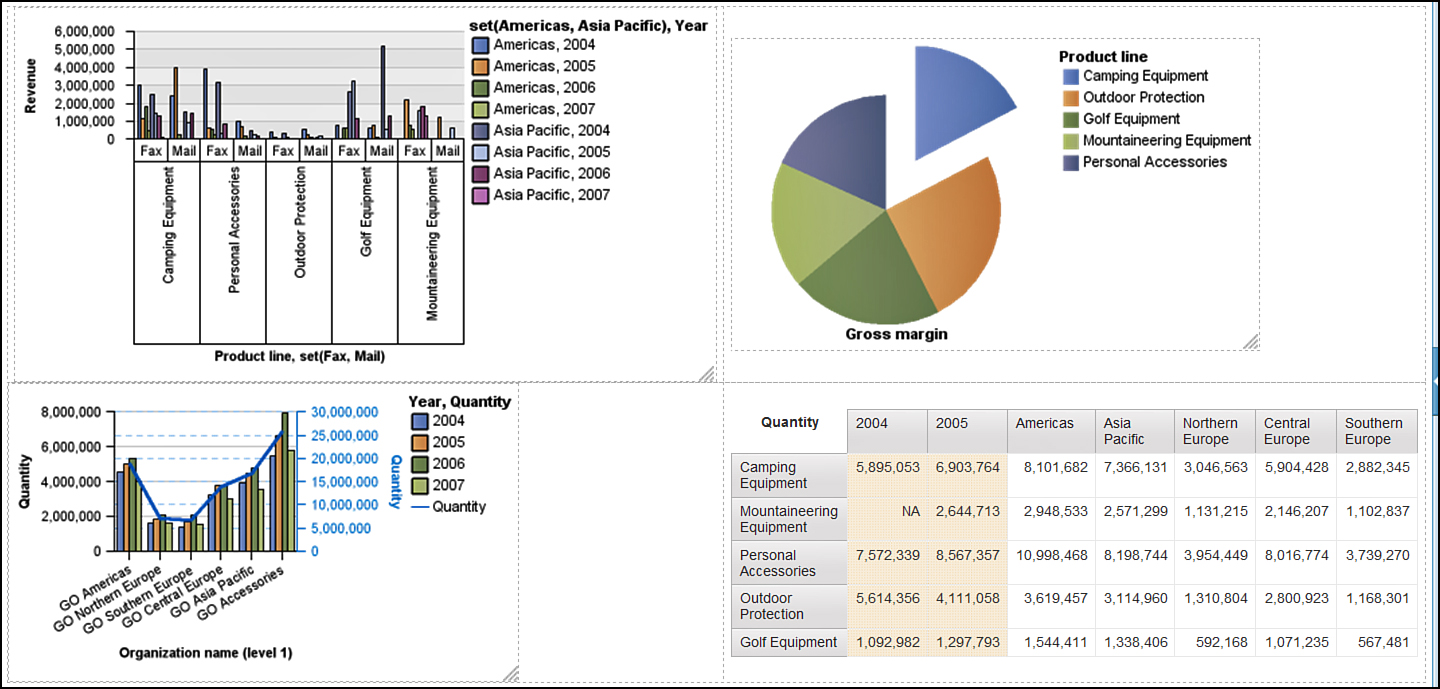
Figure 9.63. Final output of dashboard report.
1. Click the New icon on the Standard toolbar to create a new report.
2. Ensure the package GO Data Warehouse (analysis) is selected.
3. Click Blank > click OK.
4. Navigate to the Toolbox tab, in the Insertable Objects pane.
5. Drag and drop Table from the Toolbox onto the work area > choose 2 columns and 2 rows.
6. Click OK.
NOTE: You see a 2x2 table with dotted lines in the work area.
7. Drag and drop a chart from the Toolbox onto the top-left box in the table > choose Column chart (Clustered column) in the Insert Chart window > click OK.
8. Click the Source tab, maximize if required > expand Sales fact > drag and drop Revenue toDefault Measure (y-axis).
9. Expand Retailers > Regions > Members folder > Ctrl+Click Americas, Asia Pacific > drag and drop as Series (primary axis).
10. Drag and drop from Time > Year to the Series (primary axis) under <#set(Americas, Asia Pacific)#>.
NOTE: Before you drop Year, wait until you see the three blinking lines underneath <#set(Americas, Asia Pacific)#> indicating the drop zone.
11. Expand Products > drag and drop Product line as Categories (x-axis).
12. From Order method > Order method > Members > Ctrl+Click Fax, Mail, drag and drop it under Product line as Categories (x-axis).
13. Drag and drop another chart from the Toolbox onto the top-right box in the table > choosePie, Donut (Exploded Pie), in the Insert Chart window > click OK.
14. In the Source tab, expand Sales > drag and drop Gross Margin as Default measure.
NOTE: If you use a prior version of Cognos samples, you can find Gross Margin in the Sales Fact.
15. Expand Products > drag and drop Product line as Series (pie slices).
16. Drag and drop another chart from the Toolbox onto the bottom-left box in the table > chooseCombination chart (Primary Axis Clustered Bar, Secondary Axis Clustered Line), on theInsert Chart window > click OK.
17. In the Source tab, expand Sales fact > drag and drop Quantity to Default measure (y-axis).
18. Expand Time > Year > drag and drop Year as Series (primary axis).
19. Expand Organization > drag and drop Organization name (level 1) to Categories (x-axis).
20. Drag and drop a Crosstab from the Toolbox onto the bottom-right box in the table.
21. Expand Sales fact > drag and drop Quantity as measure.
22. Expand Products > drag and drop Product line as rows.
23. Expand Time > Ctrl+Click 2004, 2005 > drag and drop Year as column.
24. Expand Retailers > drag and drop Region as peer to Year column.
NOTE: You must drop Year to the right of Region when you see the three bars blinking indicating the drop zone.
25. Click the Measure Cell in the Crosstab> Properties pane > click Select Ancestor icon > select Crosstab Fact Cells > Data format > Choose Number for Format type > scroll down in the Properties section to Missing Value Characters > type NA.
NOTE: In the cell for 2004 Mountaineering Equipment, the text NA appears instead of blank.
26. Run the report via Run > Run Report – HTML.
Choosing Report Style: Cognos 8.x or Cognos 10.x
By default, new reports and objects in IBM Cognos BI v10.x use the new default report styles.
If you are a legacy IBM Cognos 8.x user and prefer to continue using Previous Cognos 8.x report style, you can do so via the Tools menu > Options > Advanced tab. Then select the check box forOverride 10.x styles with 8.x styles on new reports option.
You can also set the Report Style via the Report Actions menu > Report Properties > Report Styles. You can choose from the drop-down list any one of the following: 1.x styles, 8.x styles, 10.x styles (default), and Simplified styles.
The 8.x style enables you to work with IBM Cognos 8.x classes. Use the 8.x style if you want to preserve the appearance of the report that was created in IBM Cognos 8 in its original form.
The 1.x style should be used if you want to continue using the IBM Cognos ReportNet classes. Using this preserves the original appearance of the reports created in IBM Cognos ReportNet.
Simplified styles enable you to work with classes with minimal styling and are ideal for financial style reports.
IN A NUTSHELL: REVIEWING BY IBM COGNOS BI AUDIENCE
Depending on your role in IBM Cognos BI project implementation, you may be interested in knowing those aspects of using IBM Cognos Workspace Advanced that relate to your role on the project. The following points review IBM Cognos Workspace by role at a high level.
Architect Perspective
Architects are interested to know the capabilities of the product so that they can appropriately recommend a tool/component for the overall BI implementation. Cognos Workspace Advanced is geared toward advanced business authors who do more than drag and drop. It is an ideal solution for users who like to create reports in addition to using the existing components. You may want to understand the audience so that you can clearly articulate how many users will be using Cognos Workspace Advanced and what are their reporting needs are. Answers to these questions can help you to plan, design, and implement the dashboard requirements without compromising on performance and ensure enough/appropriate licenses exist to fulfill project needs. Some of the key questions that you may want to understand early follow:
• Who is the audience for whom Cognos Workspace Advanced is a perfect solution? Although anybody in the organization who creates reports for analysis and reporting can benefit from using Cognos Workspace Advanced, you should consider recommending it especially for advanced business authors who need to create reports without depending upon IT for every small change. In addition, Cognos Workspace Advanced should be recommended as the logical upgrade path for users who have been using Query Studio and Analysis Studio or Report Studio Express in IBM Cognos 8.
• Cognos Workspace Advanced enables its users to work with the existing trusted content by simply dragging and dropping the content onto the work area to build reports. In addition to working with the existing corporate data, Cognos Workspace Advanced users can also include in the report data from external files like Microsoft Excel (.xls), XML (.xml), comma-separated value (.csv), and tab-delimited text (.txt) files without depending on an IT department. If these external data files need to be shared by multiple users, you may want to ensure there is a shared drive/location where the files can reside and is accessible by the Cognos server.
Project Manager Perspective
Project Managers are interested in knowing if Cognos Workspace Advanced has been identified in the recommended BI solution. If it will be used, you should know what the related tasks are, skills and resources required to implement the tasks, and which phases do these belong to. Here are some points to consider:
• Cognos Workspace Advanced is an end-user Cognos component that is best suited for advanced business authors who need to create their own reports for analysis and reporting. These users may work with benchmark data, survey data, and so on and would benefit from creating reports that combine the survey/benchmark data with the existing corporate data for further analysis.
• Although Cognos Workspace Advanced is easy to use, its users can benefit tremendously from formal training. Ensure trainings are identified and scheduled where appropriate depending on the audience and culture.
• If your project includes upgrade of Cognos 8 to Cognos 10.x, recommend using Cognos Workspace Advanced, which is the logical upgrade path for Query Studio, Analysis Studio, and Report Studio Express.
• Cognos Workspace Advanced typically uses existing Cognos content and is an end-user component. These users can start building the reports after data is available and metadata modeling in Framework Manager is complete.
Business Analyst Perspective
Business Analysts should be familiar with the features of Cognos Workspace Advanced to guide the end users appropriately. Although anyone can use Cognos Workspace Advanced, if they have appropriate permissions in the IBM Cognos BI environment, your understanding of this component can guide the advanced business users/authors as the targeted audience. Some of the key requirements to gather follow:
• Does there currently exist a group of users who need to build reports for advanced analysis? Who are they? How many in numbers? After you have this information, work with the BI Architect and the Project Manager to ensure sufficient licenses exist. They may need to work with the key stakeholders if required.
• Are there users who integrate external data files (.csv, .txt, and .xml) such as benchmark data, survey data, and so on with corporate data available in IBM Cognos BI to build the reports? Understand the flexibility and limitations, for example, how big can the file be? Are these external data files shared among other users or does each person have a separate file? If these are shared files, you should work with the Cognos BI Architect to ensure these files can be made available in a shared location.
• Cognos Workspace Advanced brings together the legacy Query Studio, Analysis Studio, and Report Studio Express. With this backdrop you may want to share and encourage the legacy IBM Cognos 8.x end users to use Cognos Workspace Advanced in IBM Cognos BI v10.x to create reports that they were creating using any of these studios using IBM Cognos 8.x. Although, Query Studio and Analysis Studio are available in IBM Cognos BI V10.x, the underlying queries generated by Cognos Workspace Advanced have better performance.
• Cognos Workspace Advanced brings together reporting capabilities for a diverse audience, for example, dimensional reporting, relational reporting, and financial statement-style reporting. You should guide the end users during requirements gathering and help them understand the options available to them and the reporting style best suited for their needs. You should carefully capture this information because this forms the basis for metadata modeling. The models are designed differently for report that require drill-up and drill-down capabilities, for example, dimensional. There is no right style; it is guided by your audience’s reporting requirement.
• You should understand your audience and the culture; some may be familiar with reporting tools and can easily self-learn, whereas others may be new and can benefit from training. Being familiar with the best practices can help them create better reports.
• Identify the reports that require users to drill up/drill down the data in the report. It is not uncommon that the same data needs to be packaged both dimensionally and relationally for different audiences in the organization. Carefully capture this requirement and share it with the Metadata Modeler.
• Capture the reporting requirements and understand that the data required for reporting is logically grouped together in a package because a report can be based on a single package.
Developer Perspective
Developers refers to the Cognos development team. Cognos Workspace Advanced uses the metadata available to build the reports. The Metadata Modeler must thoroughly understand the requirement around the customer’s need for Cognos Workspace Advanced reporting and the audience. You must give careful consideration to some of the points highlighted here:
• Understand the need of end users regarding external data file usage. Does their requirement exceed the default maximum file size that you can import: 2.5 MB, with a maximum of 20,000 rows? If yes, what is their need? Change the default setting to what is required for the Maximum external data file size and Maximum external data row count governors setting in IBM Cognos Framework Manager.
• Work with the Business Analyst to understand your audience, which can help you model the metadata appropriately. For example, your understanding of users’ need for drill up and drill down can help you design a dimensional model rather than relational and the appropriate hierarchy required in the dimensional model.
• Work with the Business Analyst to understand if there are any special needs for how the metadata is to be packaged, is there just one group of people accessing everything, or you need to create separate package for each group, for example, Human Resources, Finance, and Marketing. Does everyone see all the packages or are they restricted to their own piece of information?
• Work with the Business Analyst to understand if there are any expectations on how the metadata should be made available to the end users, for example, folder structure. It is not uncommon when moving from a legacy system to IBM Cognos BI that end users want to retain some of the look and feel in the new environment.
• As Metadata Modeler, you must understand the packaging requirements clearly because after the report is created developers cannot switch to using another package without recreating the report.
End User Perspective
End Users for Cognos Workspace Advanced are advanced business users/managers. Some of the things you should think about, as a starting point, are listed here:
• How do I know if this is the right tool for me? If you are an advanced business user/manager who is always creating reports for yourself or others from scratch, joining corporate data with data from external files like Microsoft Excel, Text, and so on, creating calculations, filters, conditionally highlighting exceptions in the report, Cognos Workspace Advanced is the right choice for you.
• Ensure that the report, report parts, charts, and so on have logical names that can make it easy for the business users to identify the report part when they drag and drop objects onto the workspace in Cognos Workspace.
• Work with your Business Analyst/developers to ensure that the information you require to build your reports is available to you in the metadata model.
• When building your reports remember to apply the leading practices for report building. For example, you may be tempted to provide a lot of related information in the report; however, too much information may lead to a cluttered report making it hard to read.
• Use features like nesting to broaden the perspective of the report; however, remember nesting more than 2 to 3 levels may make the report hard to read.
• If you plan to use external data files along with corporate data for your analysis, inform the Business Analyst during requirements phase, or work with the IBM Cognos BI Administrator to ensure you have privileges granted to work with external data files.
• If you intend to share your external data files, for example, Microsoft Excel, TXT, and so on, files with other Cognos BI users, you must let the Business Analyst or IBM Cognos BI Architect/IBM Cognos BI Administrator know, so they can ensure that these files are located in a shared drive accessible by Cognos software.
• If your reporting needs require drill-up and drill-down capability, you must share this with the Business Analyst during the requirements gathering sessions. This is a critical piece of information for the Metadata Modeler because the dimensional models are built differently to cater to the drill-up and drill-down capabilities.
IBM Cognos BI Administrator Perspective
IBM Cognos BI Administrators should work together with the team and guide it to build a robust solution that yields good performance. There are many situations in which a choice must be made between easy to implement and easy to maintain. You can help the team make the right decision based on the infrastructure, unique customer situation, and culture. Some of the points worth considering are
• You should work together with the team to identify if there are Cognos Workspace Advanced users; although Cognos Workspace Advanced is part of Core IBM Cognos BI, the organization culture may not require it being used. In addition, if there are Cognos Workspace Advanced users, appropriate licenses are available to support the project needs.
• Cognos Workspace Advanced enables users to join existing IBM Cognos content with data in external files, for example, their Microsoft Excel, Text files, and so on. Understand their needs for external data files usage and ensure permission on Allow External Data capability is granted.
• Work with the Business Analyst to understand the requirements regarding external data file usage. Are these files shared with multiple users or does each one have their own file? For a shared-file scenario, ensure that there exists a location in which the files can be stored for shared usage that is also accessible by the Cognos servers.