IBM Cognos Active Report
Active Report is a report output type in Report Studio introduced in IBM Cognos BI V10.1. It is an easy-to-use, self-contained Business Intelligence (BI) application that provides highly interactive managed dashboard capabilities.
Active Reports are built by professional report authors for end users who either require managed dashboards or are offline remote users. Active reports can be scheduled, distributed, and burst in the same way as you would a PDF (report) or another report output type in IBM Cognos BI environment. Users can use Active Reports disconnected from the server but with full interactivity.
This chapter is structured to address the needs of both Active Report end users and report authors. If you are an Active Report consumer, the section “Active Report for End Users” is relevant for you. The section “Active Report for Report Authors” presumes that you have prior knowledge of Report Studio because an Active Report is a report type available in Report Studio. If you are new to IBM Cognos Report Studio, it is recommended that you review Chapter 10, “IBM Cognos Report Studio,” prior to building Active Reports to get the full benefit from this chapter.
KEY FEATURES OF ACTIVE REPORTS
Typically, the choice of a report output type is driven by the reporting requirements and end-user needs.
This section provides some of the key points for considering Active Reports:
• Disconnected Consumption: Enables you to work with Active Reports even when you are on the go and working disconnected from the Cognos BI server. Because it is self-contained and stands alone, you can take it with you anywhere and continue to explore the data when working with peers, functional heads, and customers. In addition, because the reports are consumed disconnected from the Cognos BI server, it reduces the resource consumption on the Cognos BI server.
• Interactivity: Enables you to continue to explore and analyze the data via the highly interactive gestures supported in the Active Reports, for example, sorting, filters, and so on. Because you can apply filters and sorting in one single report, this may allow you to collapse/combine multiple traditional static reports into one, thus reducing the number of reports you need to manage and maintain. This enhances productivity because users do not need to always be connected to the BI server to make decisions because they can now interactively explore the data in the Active Report and make quick decisions wherever they are unlike being restricted to just viewing the data in a traditional PDF output.
• Distribution: Supports distribution of Active Reports via email without depending on being connected to the Cognos BI server for report consumption or those who do not have access to IBM Cognos BI environment. You can distribute an Active Report using the existing bursting and scheduling functionality available in IBM Cognos BI.
• Single Authoring Environment: Enables you to create standard report output types and Active Reports using the same Cognos content in Report Studio. You can convert an existing nonactive report built using Report Studio to an Active Report easily, allowing report authors to reuse the existing queries and charts.
• Portable: Enables business users and executives to consume the IBM Cognos BI content using a Mobile native iPad application. It transfers automatically to the iPad. Standard report controls automatically have the native iOS look and feel with interactive gestures such as swiping enabled.
• Enhanced Analysis: Users can perform enhanced analysis using drill-through capabilities while connected to the Cognos BI server.
TARGETED ACTIVE REPORT USERS
Any user who requires an interactive managed dashboard can use Active Report. It can be an ideal choice for Executives, Managers, Sales force team members and the like who often work disconnected from Cognos BI servers but need to make quick decisions based on factual BI data, wherever they are. Business users and others in the organization can use Active Report when connected to the BI servers and tap into additional query and analysis features available in the Cognos BI environment.
ACTIVE REPORT FOR END USERS
This section covers topics relevant for end users, that is, those who consume the Active Reports. It familiarizes you with features and functions available when you use an Active Report, for example, how to download an Active Report, run it, and so on.
Not all features listed in the section “Data Selection Options When Using an Active Report” may be available to you in a single Active Report. Options available in the Active Report are preconfigured by the report author, based on reporting requirements.
Prerequisites for Consuming Active Reports
Active Reports are MHT files supported in Microsoft Internet Explorer (IE) 7.0+ and Mozilla Firefox. When using Firefox you must install a required plug-in (UnMHT).
Data Selection Options When Using an Active Report
Users can interact with the data in an Active Report by leveraging familiar controls that enable selection, sorting, and filtering. Some of the available controls are discussed in this section.
You can apply filters in the Active Report and analyze your report while working disconnected from the Cognos BI Servers. Filters enable you to focus the data in the report to display values that are important for the business/analysis. Depending upon your requirement, the interactivity can be built into an Active Report that allows end users to hide/show columns in the report to support their analysis.
Figure 6.1 shows some of the filter options that you can use in Active Reports to filter or specify the data to display in the Active Reports, which are discussed in the list that follows.
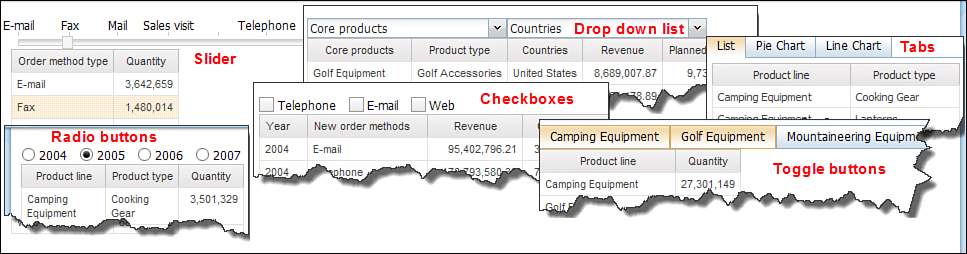
Figure 6.1. Options to filter data in an Active Report—slider, drop-down list, radio buttons, and so on.
• Check boxes: Enable you to select one or more options available for selection. The data in the report is included or excluded depending on the check boxes selected.
• List and drop-down List Control: Enables you to view all the options available to you to include in the report. You can select one or more items from the list. You can provide a static list item in a drop-down list using the No Value List Item property, for example, All to display all values by default.
• Push Button Controls: Enable you to work with button bars and data button bars that work as toggles. You may select or deselect the options in the button bars to include or exclude associated value in the report. This option enables you to work with one button at a time.
• Radio Buttons: Enable you to work with one choice at a time from all the available options. The radio button you select drives the data displayed in the report.
• Toggle Buttons: Enable you to add one or more selections from the Toggle buttons to the report.
• Slider and Iterator: You can also use Slider and Iterator controls for filtering data in the report. These options are discussed in detail in the section, “Active Report for Report Authors.”
Active Report Security
When consumed from within an IBM Cognos BI portal, Active Report uses the same security defined in the IBM Cognos BI environment.
If the Active Report is consumed outside of the IBM Cognos BI environment as an MHT file (that is, a flat file), it must be secured using features supported by the operating system. These files cannot be password protected.
The method to secure the Active Report can vary depending upon how it is deployed. For example, if you use email to distribute the Active Report, the report is secured within the corporate email system; however, if you save Active Report to a network location, you can restrict access to that location, thus allowing only those users who should have access to the report.
The data level security if applicable is addressed using the security permissions of the person running the report via the Cognos portal. You can distribute the report to users via the Burst mechanism in Cognos BI. Bursting enables you to distribute the same report to different users with data sets that are relevant to each user category, for example, department, region, and such.
Active Report Consumption
To ensure license compliance, you can consider placing an access code on the IBM Cognos Active Report output. This is controlled by the author of the report, and the access code in such cases is same for all users. The purpose of the access code is to limit report consumption to licensed users and should not be confused with Active Report security that authorizes the user with permissions required to use the report. Alternatively, you can save the Active Report in a folder accessible by authorized users only. To use IBM Cognos Active Report content, users must be a named user of Active Report Recipient orEnhanced Consumer. You can also purchase a Processor Value Unit (PVU)-based Active Report license to distribute the reporting application to the entire organization or external customers, partners, or other users.
Active Reports can be consumed in Cognos Connection, via email distribution, or on an iPad through the Cognos native mobile application.
Run Active Report
You can run an Active Report from Cognos Connection. To work disconnected you must run it once using Run with Options and save the report output. To consume an Active Report disconnected from the Cognos BI server, download the report using steps listed in the section “Download Active Report for Offline Consumption.”
Because the report has data reflected at the time the file was generated, you must rerun the Active Report from Cognos Connection to refresh the data in the report. You can manually download the report with updated data each time you need to work with the latest version of data, or you can schedule the Active Report to run at a wanted frequency and distribute it using a standard report distribution process, for example, email. For details on how to schedule a report refer to Chapter 3, “Explore IBM Cognos Connection.”
To run an Active report and refresh the data in the report, locate the report in IBM Cognos Connection > in the Actions column, click the Run with Options > click the Run button.
To work with the Active Report, you can open the report using these steps:
1. Locate the active report file (.mht file).
2. Right-click the file, for example, Products Sold by Year.
3. Select the applicable browser to open the Active Report, for example, Internet Explorer (V7.0 or higher) or Mozilla Firefox.
NOTE: Mozilla Firefox users must delete the URL filter by selecting Tools > IE Tab + option > navigate to Sites Filter tab > right-click /^file:\/\/\/.*\.(mht|mhtml)$/ > Delete.
Download Active Report for Offline Consumption
As an end user you can download an Active Report from IBM Cognos Connection so that it is available for offline consumption.
To download an Active Report, perform these steps:
1. In IBM Cognos Connection, locate the Active Report to download, for example, Products Sold by Year.
NOTE: You can use a sample Active Report delivered with Cognos BI software, for example, Public Folders > Samples > Models > GO Sales (query) > Active Report > Product Details.
2. Click the Run with Options icon (in the Actions column).
3. In the Run with Options window, Delivery section > select the Save the report radio button.
4. Optionally, if you require specifying email recipients, click the Advanced Options link.
5. Click the Run button.
6. Click the check box View the Details of This Report After Closing This Dialog.
7. Click OK.
8. In the View run history details window, after the Status displays as Succeeded > in the Active Report section > Report Outputs section > click the Yes link.
9. In the View report output versions window, Actions column > click the download icon > in theFile download dialog box > choose Save > specify the File Location and Name > click Save button > once the download complete message is displayed > click Close.
10. Navigate to the report download location, for example, c:/SampleOutdoorReports folder.
NOTE: The Active Report file will have extension .mht.
11. Double-click the Products Sold by Year.mht file.
NOTE: The report will open in the browser window.
12. Close the browser window to close the report.
ACTIVE REPORT FOR REPORT AUTHORS
If you are new to Report Studio, it is recommended that you review Chapter 10 prior to building Active Reports to get the full benefit from this chapter.
Creating an Active Report
You can create an Active Report by selecting the new report output type, Active Report or Blank Active Report, in Report Studio as shown in Figure 6.2. When you choose one of the Active Report output types to build your report, you notice the toolbox tab has additional options available, which you can use to build and support the interactive behavior in the Active Report.
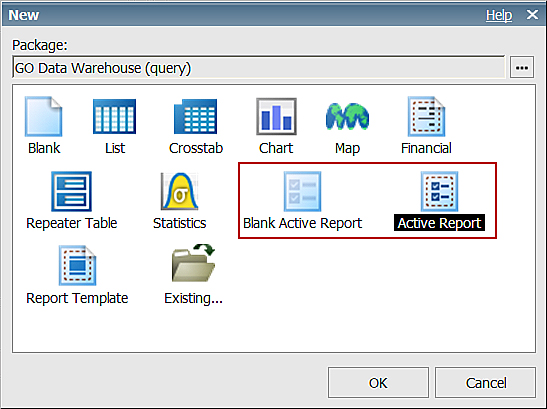
Figure 6.2. Active Report template in Report Studio.
Reusing an Existing Report Studio Report to Build an Active Report
You can reuse your existing Cognos Content to build an Active Report, if required, by converting an existing report to Active Report, as shown in Figure 6.3. After the report converts, you cannot convert it back to a nonactive report without re-creating the same. It may be a good idea to make a copy of the existing nonactive report first and then convert that to an Active Report. Alternatively, you can convert the existing report to an Active Report and save the new Active Report with a different name. When you convert a nonactive report to an Active Report, the report does not automatically become interactive. You must apply the interactive behavior to the report by adding the Active Report Variables and Controls to give it the wanted interactive behavior.

Figure 6.3. Converting a regular Report Studio Report to an Active Report.
The steps to convert a nonactive report to an Active Report are as follows:
1. In Cognos Connection, click Launch > Report Studio > Open the nonactive report.
2. Click File menu > select Convert to Active Report.
NOTE: When step 2 completes, the report displays the icons for Interactive Behavior and Create New Connection.
3. Save the report with a new name.
From here you can continue to add Active Report Controls and Variables to add interactivity to the report.
Also, if the report contains any objects that are not supported in Active Reports, those objects will be removed when you convert the report to an Active Report, for example, bookmarks, prompt controls in a report page, table of contents, and table of contents entries.
High-Level Active Report User Interface
You can now explore the user interface of an Active Report output type to become familiar with the options available. Although most options are those that are available to you with other report output types, for example, List or Crosstab, some additional options are available with the Active Report output type.
To explore the Active Report interface, you can create a new active report.
In Cognos Connection, select Launch > Report Studio > select the Blank Active Report orActive Report output type from the New window (refer to Figure 6.2) to work with an Active Report. This brings you to the Active Report template, as shown in Figure 6.4. Examine the options available. The user interface is similar to what you use in Report Studio. These options are briefly discussed in the list that follows (for additional details refer to Chapter 10).
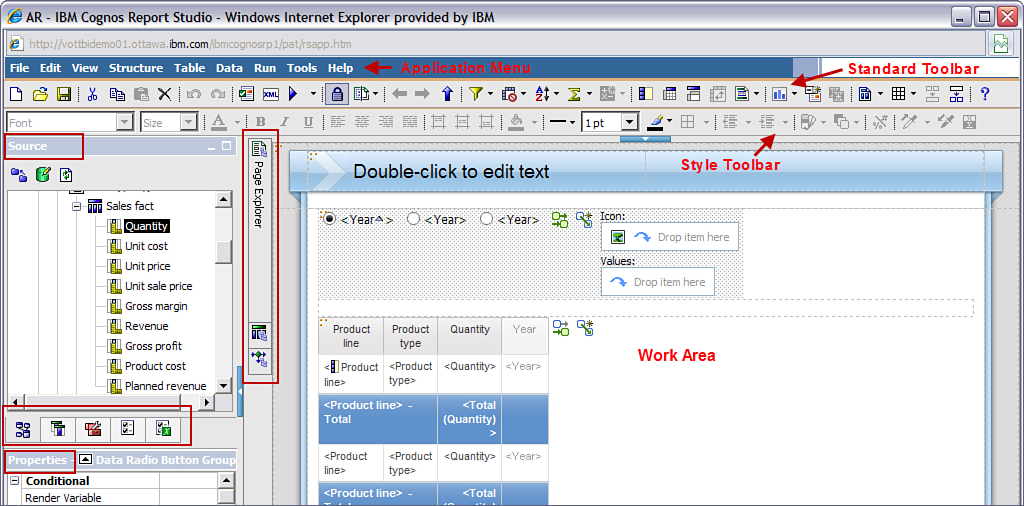
Figure 6.4. Active Report user interface.
• Application Menu: Provides options that enable you to work with and manage the report and its objects.
• Standard Toolbar: Provides frequently used options from the Application Menu.
• Style Toolbar: Provides options that you can use to enhance your report, for example, Fonts, Color, and more.
• Insertable Objects pane: Consists of the Source tab, Data Items tab, Toolbox tab, Active Report Controls tab, and Active Report Variables tab. Use objects from appropriate tabs to build the report.
• Properties pane: Enables you to specify the property of an item or object in the currently opened report.
• Explorer bar: Enables you to navigate between the Page Explorer, Query Explorer, and Condition Explorer.
• Work area: Used to build the report by dragging and dropping items from the Insertable Objects pane and other tabs, previously listed.
Basic Components in Building an Active Report
To build an Active Report, use the same report building techniques and components, for example, List,Crosstab, Chart, and such along with additional items available in the Toolbox tab that enable you to add interactive behavior to the report (for example, Tab Controls, Button Bars, List Boxes, Data Decks,Radio and Button Groups). In an Active Report template, there are additional tabs available along with the Source, Data Items, and Toolbox available in a regular Report Studio report. The two additional tabs in an Active report are Active Report Controls and Active Report Variables. The Active Report Variables tab enables you to create and manage Active Report Variables. The Active Report Controlstab provides an overview of the interactivity configured in the report and can also be used for control selection.
Active Report Controls
Active Report Controls are used to create the layout of the report and specify filter, sorting, and navigation options of the report.
The layout of the report can be defined using controls. For example, Tab controls enables you to group similar items together as Tabs, or a Deck of cards enables you to layer report items into individual cards. In addition, you can use check boxes to hide or show columns in the report, depending upon the check boxes you select. You can use Row numbers to display the number of rows in the control.
You can specify your data selection criteria in the Active Report by using check boxes, List and drop-down control lists, Toggle buttons, Radio buttons, Push buttons, and more.
Use the Navigation control options such as the Slider and Iterators to easily navigate through the Active Report data.
Lastly, you use the Data Containers such as List and Crosstab in the report. In an Active Report, these are considered as controls because you can add interactive behavior to them.
Controls play an important role to determining the behavior of the report. There are two types of Active Report controls, Static and Data Driven. Use static controls to manually define variables. Data-driven controls have data items associated with them that define the value assigned to it.
You can view the Active Report controls in the Toolbox tab. When in the Toolbox tab, you can right-click anywhere in the Toolbox pane and choose Active Report Toolbox Items to focus on Active Report controls only.
The behavior of the control can be specified using Active Report variables, discussed later in this section. A control can have a selection behavior or reaction behavior. Reaction behavior defines how a control should behave based on the value of the variable that was set by another control in the report. On the other hand, Selection behavior sets the value of the variable to the selection that was made by the current control.
Active Report Variables
Use Active Report Variables with the Active Report Controls to add interactive behavior to the report. Active Report Variables enable the controls to interact with each other by passing information from one control to the other. For example, you might want to have one data frame updated automatically to reflect user changes in another.
An Active Report by itself does not define the interactive behavior; it behaves as an Active Report after the interactive behavior is added to the report. You can manage the Active Report Variables (for example, changing the name or setting default values) from the Active Report Variables tab.
When defining an Active Report Variable, you can specify the Data Type using the drop-down list, as shown in Figure 6.5.

Figure 6.5. Create and manage Active Report Variables.
If it is required that the variable be consumed by other Cognos components such as IBM Cognos Workspace, you should make the variable Public (External) by selecting the Public (External) check box, as demonstrated in Figure 6.5. When you add two or more Active Reports with same public variable names (it is case sensitive) to Cognos Workspace, the two reports can listen to each other.
If your application supports multiple languages, you must create variables to support those languages. You must also provide the translated text for any text used in static controls.
Standard Report Components
As discussed earlier, an Active Report is a regular report with interactivity added on to it. You can typically use all the reporting techniques that you would normally use to build a Report Studio Report (discussed in Chapter 10).
Interactive Elements and Behavior
You can add interactivity to the report using Interactive elements from the Toolbox tab. By default, both nonactive report toolbox items and Active Report toolbox items are listed in the Toolbox tab. To focus on Active Report Toolbox items, you can right-click anywhere in the Toolbox pane and select theActive Report Toolbox Items option. To switch back to see all the Toolbox items, right-click again and select All Toolbox Items, as shown later in Figure 6.9.
The Interactive behavior of an Active Report enables you to control the report output depending upon the user choices (for example, filters, sorting, summaries, and hide or show columns). You can define the interactive behavior using the Interactive Behavior property in the Properties pane.
Some of the options available to you are as follows:
• Allow Sorting option: Enables you to specify if users can sort the data in a list using Yes/No options from the drop-down list for this property; the default is No.
• Column Visibility option: Enables you to hide/show a column in a list or a row/column in a Crosstab using one of the three options via the drop-down list (for example, Visible [default], Hidden, and Visible based on condition).
• Clickable Region option: Enables you to specify if the object is clickable when the Active Report runs.
• Summarize in Output option: Enables you to display the summary of only what currently displays in the Active Report, for example, when the filter values changes, the summaries change accordingly, unlike in a non-Active Report in which totals are aggregated at the time the report was run.
Control Behavior
In an Active Report, when you drag and drop an object onto the work area, for example, a List, Crosstab, and so on, you notice that they have two icons displayed on the right: Interactive Behaviorand Create a New Connection, as shown in Figure 6.6. Notice the two icons on the right of Year radio button and on the right of the Product List. You can use these icons to define interactivity and control the behavior of the objects in the report.
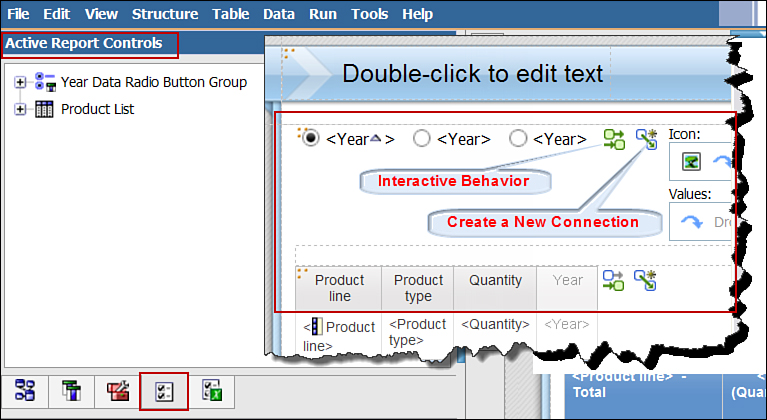
Figure 6.6. Active Report Controls.
Active Controls use variables to communicate with each other. A Control may assign a value to one or more Active Variables. A Control can also be set up to react in a certain way depending upon the content of an Active Variable.
You can view the Active Report Controls that you have created in the report via the Insertable Objects pane > Active Report Controls tab (refer to Figure 6.6).
There are three types of Reaction behaviors that you choose from when defining a control, for exampleSelect, Filter, and Enable, as shown in Figure 6.7. Each of these options is driven by the variable defined in the Active Report. The Active Report variables can be shared by multiple controls in the report and should be named logically. Doing so allows you to reuse them correctly in the application.
• Select: Enables you to select an item in a control, for example, rows or columns from a List or Crosstab in the report.
• Filter: Enables you to filter rows from a List, filter rows or columns from a Crosstab, or filter items from a List Box based on the variable, such as an item in a control.
• Enable: Enables you to disable a button, disable a list box, and such. Using enable/disable enables you to enable/disable items in the report, as required. Disabled controls are grayed out in the report.

Figure 6.7. Select, Filter, and Enable options for interactive behavior.
Connecting Controls
As mentioned earlier, you connect the different controls in the Active Report using variables. You can use as many controls as you require to implement your solution; the key point to note is to define the variables logically so that you can use them appropriately to drive the control.
High-level tasks when defining interactivity in the report are as follows:
1. Create a variable and optionally assign a default value.
2. Define the Behavior on Select for the control that drives the variable.
3. Define the Reaction Behavior for controls or objects that are supposed to respond to the variable (that is, Container Filter for a list that is to be filtered by the variable value, Control Enable for a button that is to enabled/disabled by the variable value, and so on).
You can set it manually using the Menu option (refer to Figure 6.7) or use the wizard as shown inFigure 6.8.

Figure 6.8. Create a new connection between Active Report controls.
Typically you filter a target control based on your selection in a source control, or you Select a target control based on your selection in the source control (see Figure 6.8).
Toolbox Tab Items
The Toolbox tab contains items that can be used by the report author to build a report. The list available here includes items that are used to build a standard Report Studio report (that is, not an Active Report) and those that are relevant to building an Active Report, such as Active Report Toolbox Items. The items used to build an Active Report are briefly discussed here. To see the list of Active Report Toolbox Items (described in the list that follows), navigate to the Toolbox tab > right-clickanywhere in the Toolbox area > select Active Report Toolbox Items, as shown in Figure 6.9.
• Variable Text Item: Displays the value of the variable you create in an Active Report. Active Report variables are used to store the state of the application and pass information from one control to another. Variables can be created manually from the Active Report Variables tab or created automatically when you define connections between controls. After the variables are created, you can modify or delete them as required.
• Row Number: Ensures that the rows are numbered sequentially as they are displayed in the list, which is filtered dynamically by the controls you create in the Active Report.
• Interactive Repeater Tables: Use interactive behavior in repeater tables to create button bars and grids. You can use the Active Report Repeater Table Control to build interactivity into an Active Report. The contents of the table can be filtered or selected by other Active Report controls or can be used to drive interactivity to other areas of the report. One of the key benefits of this control is that it provides a simplified method to create custom buttons or button bars. The table cells can easily be styled to achieve the wanted look and feel. Next, the Active Report interactivity can be configured on the control so that it behaves as a button.
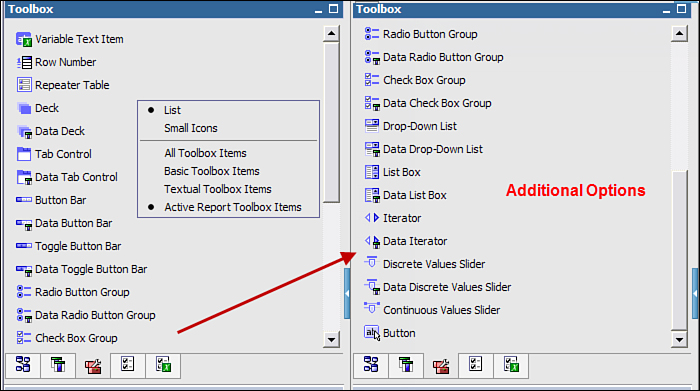
Figure 6.9. Active Report Toolbox options (partial list displayed).
• Deck: Create a wanted number of cards. As the report author you can create a deck to display the content of the item you put on the deck. Each value of the item displays on a separate card. Decks that you create manually are also referred to as Static decks. In such cases you manually add the required object to each card. You can add List, Crosstab, or Chart to a deck.
• Data Deck: Automatically create a card in the deck for each data item value used to drive the Data Deck. In this case the number of cards in the Data Deck may vary because it depends upon the underlying data in the data item assigned to the Data Deck.
• Tab Control: Used by the report author to manually create the wanted number of tabs.
• Data Tab Control: Creates Tabs based on the number of records returned by the data item.
• Button Bar: Manually creates the wanted number of buttons.
• Data Button Bar: Creates buttons based on the number of records returned by the data item.
• Toggle Button Bar: Displays manually created selectable buttons. These buttons are typically used to dynamically filter a data container.
• Data Toggle Button Bar: Displays multiple selectable buttons based on the number of records returned by a data item.
• Radio Button Group: Manually supplies the available selections displayed as a radio button choice. These values may be used to select or filter the data of a data container one radio button value at a time.
• Data Radio Button Group: Supplies the available selections as a radio button choice based on the record set returned by the specified data items. These values may be used to select or filter the data of a data container one radio button value at a time.
• Check Box Group: Manually supplies the available selections displayed as check boxes and filters the data of a data container.
• Data Check Box Group: Displays multiple selectable check boxes based on the number of records returned by a data item and allows multiple selections to filter data in a data container.
• Drop-Down List: Manually supplies the available selections displayed in a drop-down list and dynamically filters or selects data in data container.
• Data Drop-Down List: Supplies the available selections in a drop-down list based on the record set returned by a data item and can be used to dynamically select or filter data in a data container.
• List Box: Manually supplies the available selections displayed in a List Box, allowing the user to dynamically select or filter the data in a data container one value at a time by selecting the items in a List Box. You can select one or more items in the List Box.
• Data List Box: Supplies the available selections in a drop-down list based on the record set returned by the selected data item and can be used to dynamically select or filter the data in a data container one value at a time. The Data List box is driven by the data item you add to the control and enables you to select one or more items in the list.
• Iterator: Navigates the users through the values by using buttons, for example, next, previous, and so on. The report author can manually provide the available selections. You can connect it to a variable and use the iterator control to select or filter values from a data container.
• Data Iterator: Navigates users through values by using the buttons like previous, next, and so on. The report author can use the control to supply the available values based on the record set returned by a specified data item. It can be connected to a variable to allow the iterator control to select or filter values from a data container.
• Discrete Values Slider: Used by the report author to select or filter the data in the data container based on values defined by the report author. It is typically used for non-numeric filtering or selection of a data container. You can also enable a range to allow multiple sequential items to be selected at the same time. The Discrete Values Slider can either display horizontally or vertically on the report. You can change this setting from its Properties pane > General > Orientation.
• Data Discrete Values Slider: Selects or filters data in a data container based on values obtained from a data item. It is typically used for non-numeric filtering and selection of a data container. You can also enable a range to allow multiple sequential items to be selected at the same time. The Data Discrete Values Slider can either display horizontally or vertically on the report. You can change this setting from its Properties pane > General > Orientation.
• Continuous Values Slider: Selects or filters data in a data container based on manually entered numeric values. It is typically used for numeric range filtering, and the range settings can be controlled via the Properties pane > Continuous Slider section via Minimum Value, Maximum Value, andStep. Options in the Properties pane also enable you to specify if the value is Percent.
• Button: Adds additional interactivity to an Active Report and can be used to filter or select a data container. You can also use it to enable a control or set a variable.
In short, the controls can either be data driven or manual. The choice is driven by your reporting needs. It is similar to a prompt in a regular Report Studio report where you can populate the list either using static values or by building a query to populate it.
Download Active Report as a Report Author
As a Report Author, you can download an Active Report and share the output file via the Run >Download Active Report option, as shown in Figure 6.10, or schedule and distribute it using the normal report distribution methods.
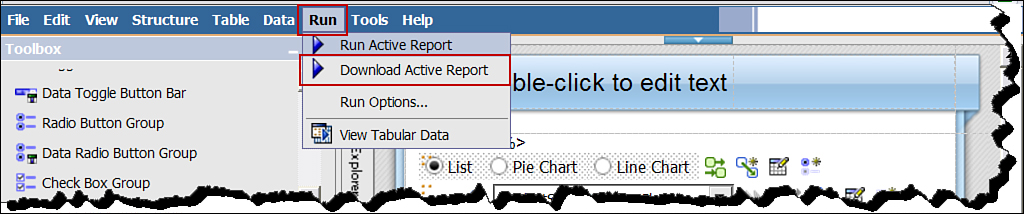
Figure 6.10. Run and download an Active Report.
Becoming Familiar with Active Report Toolbox Items
This section introduces you to the functionality of Active Report Toolbox Items and guides you through the steps to create them using separate examples.
Creating a Variable Text Item
Use the Variable Text Item from the Toolbox tab to display values of Active Report Variable in the report.
As you have seen before, variables play an important role in building Active Reports. They enable you to store the state of the application, which you can then use to determine the actions that need to be performed. Note the various options available to you when working with variables, as you follow along with the exercise.
1. In Cognos Connection, click Launch > Report Studio.
2. In the Select a Package window, choose Go Data Warehouse (query).
3. In the Report Studio welcome page, select Create New.
4. In the New window, select Active Report > click OK.
5. Navigate to the Active Report Variables tab > click the Create a New Variable link.
6. In the Active Report Variable window, in the Name box, type varYear.
7. Leave the Data Type as the default for this example.
8. Click the Set Default Value(s)... link to set the default value for the variable.
9. In the Default Variable Values window, click the New icon (looks like bicycle gear).
10. Type in the value 2005 (or 2012 for Cognos 10.2 users) > click OK > click OK again.
NOTE: In the Active Report Variables tab, varYear is listed as an Active Variable with its default value of 2005 (or 2012 depending upon your selection).
11. Navigate to the Toolbox tab > right-click and choose Active Report Toolbox Items.
12. Locate Variable Text Item > drag and drop it to the work area. It defaults to the only existing variable, varYear, as shown in Figure 6.11.
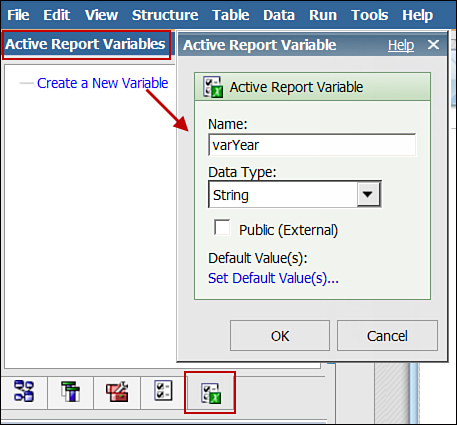
Figure 6.11. Create a new Active Report Variable.
NOTE: If you have multiple variables defined, drag and drop the Variable Text Item to the work area, which prompts you to pick the variable from a drop-down list.
13. Run the Active Report.
NOTE: The year value from the Variable Text Item (for example, the value typed in step 10) displays in the report. This item behaves like the ParamDisplayValue in Report Studio.
14. Click Run > Download Active Report > Save the report output file.
15. Save the report to use later.
Do not close the report; you use it in the next section.
Creating a Deck
Deck is an appropriate choice when you want to display different content on each card in the deck. Use the Deck item from the Toolbox to create as many cards as you need in the deck. To create a deck, refer to the steps outlined in Figure 6.12 and described in the list that follows.
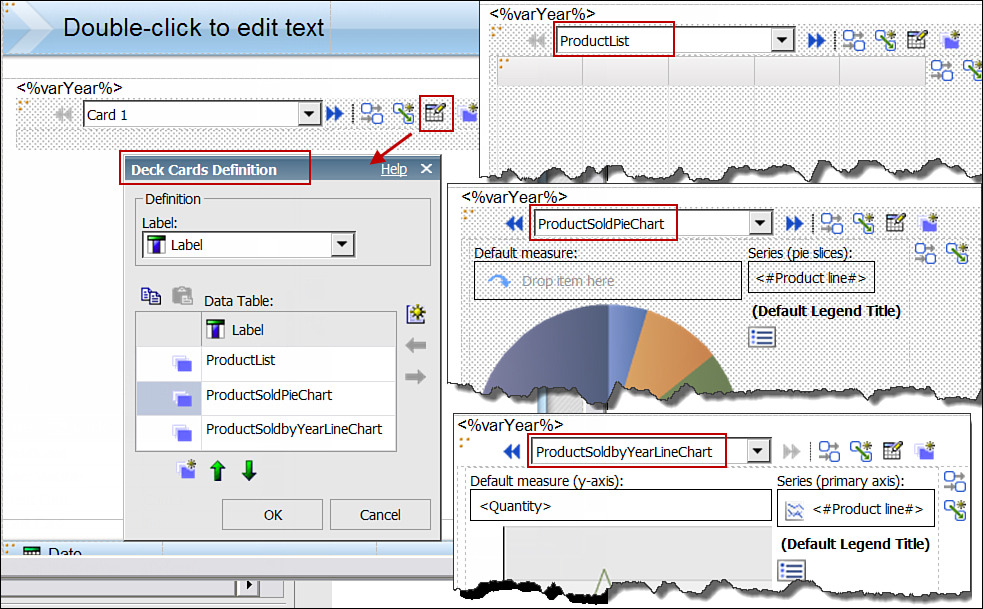
Figure 6.12. Create a Data Deck with a List, Pie Chart, and Line chart in each card.
1. Using the report you created in the previous section, from the Toolbox tab, drag and drop a Deckonto the work area.
NOTE: Click the drop-down, and notice there are three cards in the deck by default. You can Add/Remove cards as required via the Deck Cards Definition icon (with a pencil).
2. Click the Deck, in the Properties pane > Miscellaneous section > Name > typeProductListChartCrosstab Deck.
3. Click the Deck Cards Definition icon (with a pencil).
4. In the Deck Cards Definition window, under Label > click Card 1 and rename it to ProductList,Card 2 to ProductSoldPieChart, and Card 3 to ProductSoldbyYearLineChart > click OK.
NOTE: You can add a card by clicking the New icon at the bottom left of the Deck Cards Definition window. Optionally you can click to the left of the Label column (toward the blue folder) and click the delete icon (the X icon) to delete the card from the deck.
5. Right-click in the Toolbox tab and choose All Toolbox Items.
6. On the Toolbox tab, locate the List item > drag and drop it on to the ProductList Card.
7. Navigate to the Source tab, Sales and Marketing (query) > Sales (query).
8. Expand Products > Ctrl+click Product line, Product type > drag and drop to the List in the work area.
9. Expand Sales fact > drag and drop Quantity as the rightmost column in the list.
10. Click the Next Card icon (on the right double arrow) to move to the next card,ProductSoldPieChart.
11. On the Toolbox tab, locate the Chart item > drag and drop Chart item > from the Insert Chartwindow > select Pie, Donut > click OK.
NOTE: Depending upon your Report Studio setting, you may either be using Cognos 10 chart style or Cognos 8 legacy chart style. To switch to Cognos 8 chart styles instead of default Cognos 10, clickTools menu > Options...> Advanced > select the check box Override 10.x styles with 8.x on new reports > click OK.
12. Navigate to the Source tab, Sales and Marketing (query) > Sales (query).
13. Expand Sales fact > drag and drop Quantity as Default Measure.
14. Expand Products > drag and drop Product line as Series (pie slices).
15. Click the Next Card icon (on the right double arrow) to move to the third card.
16. Navigate to the Toolbox tab, locate the Chart item > select Line > click OK.
17. Navigate to the Source tab, expand Products > drag and drop Product line as Series (Primary Axis).
18. Expand Sales fact > drag and drop Quantity as Default Measure (y-axis).
19. Expand Time > drag and drop Year as Categories (x-axis).
20. Save the report as AR_ProductsSold; you build upon this report in the next example.
21. Click the Deck, in the Properties pane > Conditional section > Default Card > click the drop-down and change the value to Yes.
NOTE: The No Data Contents tab now displays in the report. This enables you to display values in the default card when no other card matches the value of the variable passed to the deck. You must then drop items that you want to display on the default card.
22. Click the No Data Contents tab > navigate to the Source tab > Products > drag and dropProduct line to the section that displays Drop items here to create contents for when there is no data.
23. Run the report.
24. Undo the change.
25. From the Toolbox tab, drag and drop a Crosstab below the Line chart.
26. From Products > drag and drop Product line as Rows, from Time > Year as Columns and from Sales fact > Quantity as Measure.
27. Run the Report.
Creating a Radio Button Group
Radio Button Group enables you to provide the available selections displayed as radio buttons manually. You can use the radio button group values to filter or select data in the data container for each radio button. The steps to create a Radio Button Group are shown in Figure 6.13 and described in the list that follows.
1. If not already open, Open the report AR_ProductsSold.
2. Navigate to the Toolbox tab; drag and drop the Radio Button Group item to the work area above the Deck (created in the previous step).
3. Click the Radio Button Group to select it. (Use the Ancestor icon or orange dots to make a quick selection.)
4. In the Properties pane, navigate to Miscellaneous section > Name > typeProductLineRadioButtonGroup.
5. Click the Radio Button Definition icon (with a pencil).
NOTE: In the Radio Buttons Definition window, you can add another button using the New icon orDelete using the delete icon (left of the Label column).
6. In the Radio Buttons Definition window, Label column > click Button Label 1 and rename it toProductList.
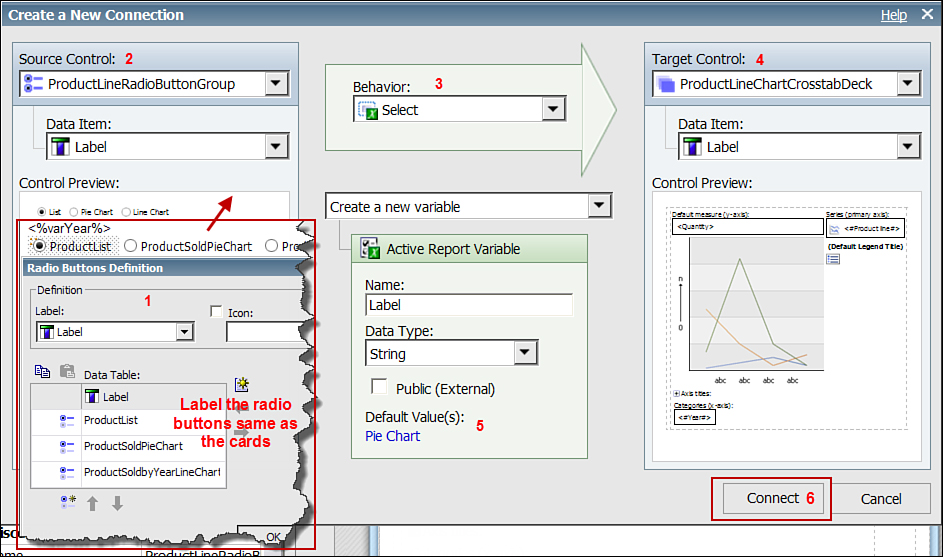
Figure 6.13. Create connection for Radio Button Group.
7. Rename Button Label 2 to ProductSoldPieChart and Button Label 3 toProductSoldbyYearLineChart > click OK.
8. Click the Create a New Connection icon of the Radio Button Group.
9. In the Create a New Connection window, set Source Control toProductLineRadioButtonGroup > Behavior to Select > Target Control toProductLineChartCrosstabDeck.
10. Click Set Default Values(s)... link.
11. In the Default Variable Values window > Values section > double-click Pie Chart, for example,ProductSoldPieChart (which should move Pie Chart to the Selected values section on right).
NOTE: Doing this ensures that when you run the report by default, the Pie Chart radio button will be selected.
12. Click OK > click the Connect button to complete creating the connection.
By default, the Deck and Radio Button Group are two objects in the report; however, they do not interact with each other. You created a connection between the Radio Button Group and the Deck to define how they should interact with each other (for example, select behavior). You also specified a default card in the deck that shows first.
Creating a Tab Control
You can use the Tab Control to create as many tabs as you require in the report, as shown in Figure 6.14and described in the list that follows.
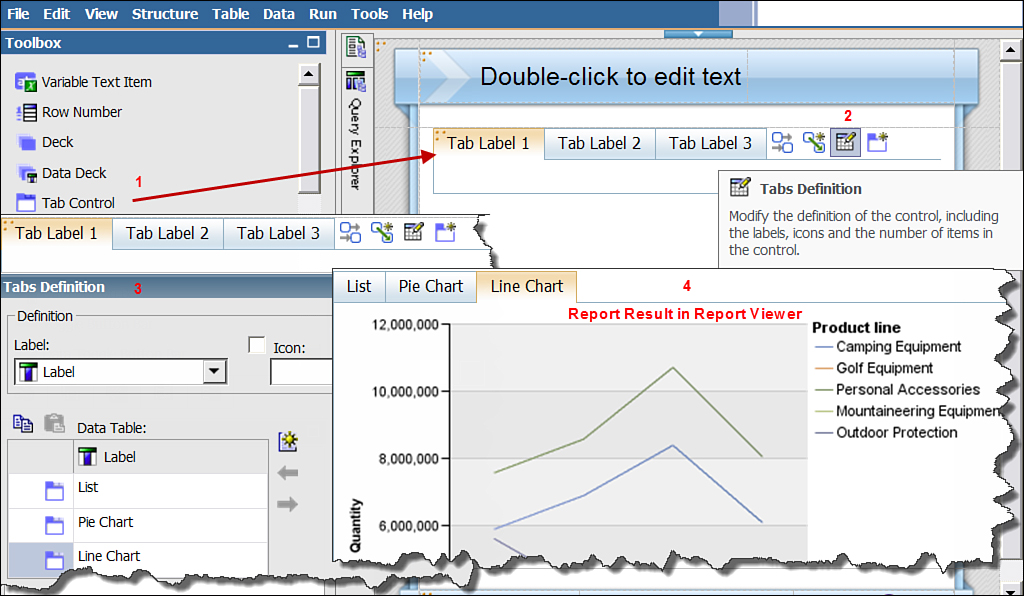
Figure 6.14. Create Tab Controls.
1. In Cognos Connection, click Launch > Report Studio > GO Sales and Marketing (query) package > Create New > Active Report > click OK.
2. From the Toolbox tab, drag and drop Tab Control to the work area.
3. Ensure the Tab Control object is selected > in the Properties pane, navigate to Miscellaneous> Name, type ProductLineListChartTabControl.
4. In the work area, click the Tabs Definition icon (with a pencil).
5. In the Tabs Definition window, rename Tab Label 1 to List, Tab Label 2 to Pie Chart and Tab Label 3 to Line Chart > click OK.
NOTE: This creates three tabs called List, Pie Chart, and Line Chart.
6. Click on the List tab, from the Toolbox tab, drag and drop List to the List tab.
7. Navigate to the Source tab, from Products > drag and drop Product line and Product type to the List.
8. Click the Pie Chart tab.
9. From the Toolbox tab, drag and drop a Chart item to the Pie Chart tab.
10. From the Insert Chart window, click Pie, Donut > click OK.
11. From the Source tab, from Products > drag and drop Product line to Series (pie slices), from Sales fact > drag and drop Quantity to Default Measure.
12. Click the Line Chart tab.
13. From the Toolbox tab, drag and drop a Chart item to the Line Chart tab.
14. On the Insert Chart window, click Line > click OK.
15. Ensure the Chart is selected (if not click on the chart first) > from Products > drag and dropProduct line as Series (primary axis), from Sales fact > drag and drop Quantity as Default Measure (y-axis), and from Time > drag and drop Year as Categories (x-axis).
16. Run the report, and navigate to the different tabs.
Creating a Data Toggle Button Bar and Data Check Box Group
The Data Toggle Button Bar displays multiple selectable buttons based on the number of rows returned by the data item. The buttons behave as a toggle; clicking a button includes the related data in the report, and clicking the same button again excludes the data from the report. Figure 6.15 outlines the effects of using a Data Toggle Button Bar, and the list that follows describes how to create it.

Figure 6.15. Creating a Data Toggle Button Bar and Data Check Box Group.
1. In Cognos Connection, click Launch > Report Studio > GO Data Warehouse (query) package > Create New > Active Report > click OK.
2. From the Toolbox tab, drag and drop a Data Toggle Button Bar onto the work area.
3. Click the Data Toggle Button Bar > in the Properties pane > navigate to Miscellaneous >Name, type OrderMethodDataToggleButtonBar.
4. From the Source tab > Sales and Marketing (query) > Sales(query) > Order method > drag and drop Order method type to Data Toggle Button Bar (in the Drop item here area).
5. From the Explorer Bar > choose Query Explorer > click Query 1 > in the Properties pane >Miscellaneous > Name, type OrderMethodDataToggleBarQuery.
6. From the Explorer Bar > choose Page Explorer > click on Page 1.
7. Navigate to the Toolbox tab, right-click List, and drag and drop it onto the work area below the Data Toggle Button Bar.
8. Choose Insert using existing query....
9. From the Choose query window >select OrderMethodDataToggleBarQuery > click OK.
10. Click the List in the work area > navigate to the Properties pane > Miscellaneous > Name, type ProductLineList.
11. Navigate to the Source tab, Products > Ctrl+Click Product line, Product type > drag and drop it onto the List in the work area.
12. From the Sales fact > drag and drop Quantity as the rightmost column in the list.
13. Click the Data Toggle Button Bar > right-click and choose Create a New Connection.
14. In the Create a New Connection window, select Source Control > asOrderMethodDataTogglebar, Behavior > Filter and Target Control > ProductLineList(refer to Figure 6.15).
15. In the Create a New Connection window, click Set Default Value(s)....
16. In the Default Variable Values window, in the Values section, select E-mail > click the right green arrow > E-mail should be displayed in the Selected values section > click OK.
17. Click Connect button to create the connection.
NOTE: Order method type1 appears grayed out in the List because this item is used for filter purposes; however, it will not be displayed in the report. To display its value for troubleshooting purposes, continue with step 18.
18. In the List, click Order method type1 column.
19. In the Properties pane > Interactive Behavior section > Column Visibility > click theellipses and select the radio button option Visible > click OK.
NOTE: For Column Visibility the other options available are Hidden and Visible based on condition.
20. Run the Report
NOTE: Because the default value was set to E-mail, the report displays rows with E-mail Order method type only. When you click other Order method types (for example, Fax, Mail, and Sales visit) they get included in the report. Clicking any of these values again (for example, Fax, Mail, Sales visit, or E-mail) excludes it from the report display.
21. Click Fax, E-mail, notice the rows with order method Fax is added to the list, whereas rows with order method E-mail is removed.
22. Click Order method type in the List in Properties pane > Interactive Behavior section >Column Visibility > change to Hidden > click OK.
23. Save the report.
You can use the Convert Control option to convert the Data Toggle Button Bar to a Data Checkbox Group if required. To convert a Data Toggle Button Bar to the Data Checkbox Group, click the Data Toggle Button Bar > right-click > choose Convert Control > Data Checkbox Group. (Remember to name the Data Checkbox Group appropriately for future reuse!)
1. Click the Data Toggle Button bar > right-click and choose > Convert Control > choose Data Check Box Group.
2. Run the report.
NOTE: You can select multiple Order method type using the check box option.
3. Click Order method type in the List > in the Properties pane > Interactive Behavior section > Column Visibility > click the ellipses > select Visible > click OK.
NOTE: You changed the Column Visibility to visible for troubleshooting purposes.
4. Run the report.
5. Select the check box for Fax and E-mail; note the data is now included in the report.
6. Save the report as Products by Order Method.
Creating a Data Iterator
Data Iterators are useful when you want to provide navigation options to the user such as first, last, previous, and next. Figure 6.16 outlines how to create a Data Iterator for a Crosstab report, as described in the list that follows.

Figure 6.16. Create Data Iterator for a Crosstab report.
1. In IBM Cognos Connection, click Launch > Report Studio.
2. From the Select package window, choose GO Data Warehouse (query).
3. In the New window > choose Create New > Active Report > click OK.
4. Navigate to the Toolbox tab, drag and drop a Table to the work area > choose 3 columns and 1 rows.
5. Drag and drop a Data Iterator to the left cell in the table.
6. Click the Data Iterator > Properties pane > Miscellaneous > Name, typeProductLineDataIterator.
7. In the Explorer bar > navigate to the Query Explorer > click Query1 > in the Properties pane> Miscellaneous > Name, type ProductLineOrderMethodDeckQuery.
8. In the Explorer Bar > navigate to the Page Explorer > click Page 1.
9. From the Toolbox tab, locate the Data Deck object > right-click and drag and drop the Data Deck to the middle cell of the table in the work area.
10. Select Insert using existing query... when prompted.
11. Choose ProductLineOrderMethodDeckQuery > click OK.
12. Click the Data Deck; navigate to the Properties pane for the Data Deck > Miscellaneous >Name > type ProductLineOrderMethod_Deck.
13. Navigate to the Source tab, Sales and Marketing (query) > Sales (query) > Products > drag and drop Product line to the Label area of the Data Iterator.
14. Navigate to the Data Items tab > drag and drop Product line to the Values area in the Data Deck.
15. Navigate to the Toolbox tab > drag and drop a Crosstab object to the Data Card.
16. Navigate to the Source tab, Sales (query) > Products > drag and drop Product line asRows.
17. From Sales (query) > Products > drag and drop Product type as Columns.
18. From Sales (query) > Order method > drag and drop Order method type as Rows, next to Product line (nested within Product line).
19. From Sales (query) > Sales fact > drag and drop Quantity as Measures.
20. Navigate to the Query Explorer > select Query1 > in the Properties pane > Miscellaneous> Name > type ProductLineOrderMethodCrosstabQuery.
21. In the Explorer Bar > navigate to the Page Explorer > click Page 1.
22. Click the Crosstab, navigate to the Properties pane (for the Crosstab) > Data > Master Detail Relationships > click the ellipses.
23. In the Master Detail Relationships window, click the New Link button > select Product line (Master) and Product line (Detail) > click OK.
24. Click the Data Iterator > click Create a New Connection icon.
25. In the Create a New Connection window, select Source Control > ProductLineDataIteratorand Target Control > ProductLineOrderMethod_Deck.
26. In the Create a New Connection window, ensure the Behavior > Select.
27. In the Create a New Connection window, Active Report Variables section > Name > typevarProductLine.
28. Click the Set Default value(s)... link > in the Values section, select Camping Equipment > click the right green arrow to move it to the Selected Values section > click OK.
29. In the Create a Connection window, click the Connect button.
30. Select the Data Iterator (if not already selected) > click the Copy icon on the Standard toolbar.
31. Navigate to the rightmost cell of the table in the work area > click Paste on the Standard toolbar.
32. Select the Data Iterator (in the rightmost cell) > in the Properties pane > General > set theIterator Next as Show and all other Iterator values (Previous, Label Area, and Last) as Hide.
33. Navigate to the Data Iterator (in the leftmost cell) > in the Properties pane > General > set the Iterator Previous as Show and all other Iterator values (Label Area, Next, and Last) as Hide.
34. Run the Report.
NOTE: The Previous and Next iterators can now be used to move from one Product line to another.
Creating a Data Discrete Values Slider
Data Discrete Values Slider enables the user to filter or select non-numeric values obtained from a data item. It can also enable a selection of multiple values at the same time. Figure 6.17 outlines how to create a Data Discrete Values Slider, as described in the list that follows.
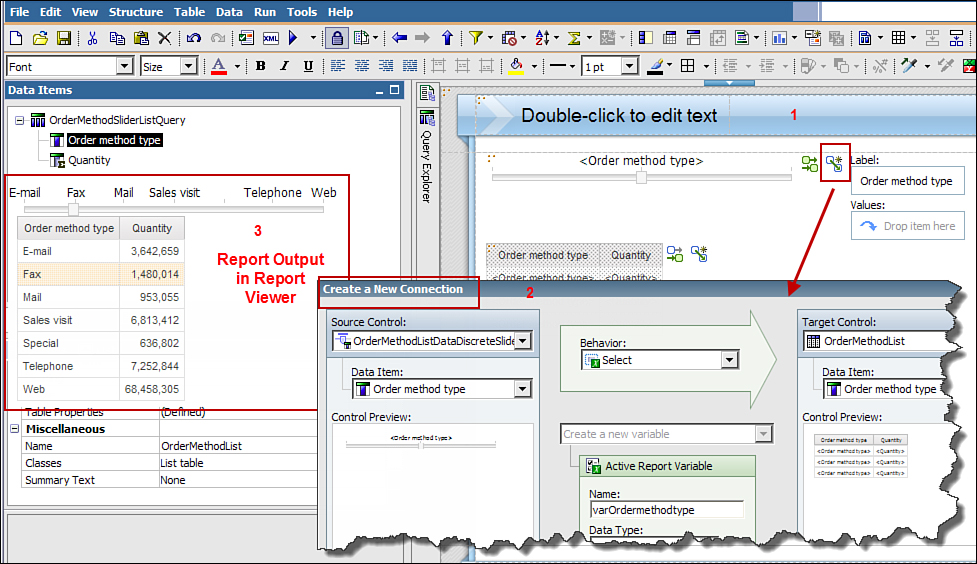
Figure 6.17. Create a New Connection for Data Discrete Values Slider.
1. In IBM Cognos Connection, click Launch > Report Studio.
2. In the Select package window, select GO Data Warehouse (query) package.
3. In the New window, click Create New > Active Report > click OK.
4. Navigate to the Toolbox tab > drag and drop a Data Discrete Values Slider to the work area.
5. Ensure Data Discrete Values Slider is selected > navigate to the Properties pane >Miscellaneous > Name > type OrderMethodListDataDiscreteSlider.
6. From the Explorer bar > navigate to the Query Explorer > click Query1 > in the Properties pane > Miscellaneous > Name > type OrderMethodSliderListQuery.
7. From the Explorer bar > navigate to the Page Explorer > click Page 1.
8. Navigate to the Toolbox tab, right-click (hold) drag and drop List object to the work area, below the Data Discrete Values Slider.
9. Select Insert using existing query..., when prompted.
10. In the Choose Query window, select OrderMethodSliderListQuery > click OK.
11. Click the List in the work area (or use the ancestor icon to select the List) > navigate to itsProperties pane > Miscellaneous > Name > type OrderMethodList.
12. Navigate to the Source tab, Sales and Marketing (query) > Sales (query) > Order method> drag and drop Order Method Type to the List.
13. From Sales fact > drag and drop Quantity to the List.
14. Click the Data Discrete Values Slider > navigate to the Data Items tab, drag and drop Order method type > Labels drop zone of the Data Discrete Values Slider.
15. Click the Create a New Connection icon for the Data Discrete Values Slider.
16. In the Create a New Connection window, select Source Control >OrderMethodListDataDiscreteSlider, Behavior > Select, Target Control >OrderMethodList.
17. In the Create a New Connection window, Active Report Variables section > Name section; type varOrdermethodtype.
18. Click the Set Default Value(s)... link.
19. In the Default Variable Values window > Values section > click Fax > right green arrow and move it to the Selected values section > click OK.
20. In the Create a New Connection window, click Connect button.
21. Run the Report.
NOTE: Fax is selected by default because you assigned it as the default value. Move the slider to see the selected value changes.
Data Drop-Down Lists
Data drop-down lists provide users a list of values to choose from to filter data. The list is driven by a data item that was added to the control. Figure 6.18 outlines creating a new connection and setting a default value for the drop-down list, as described in the list that follows.
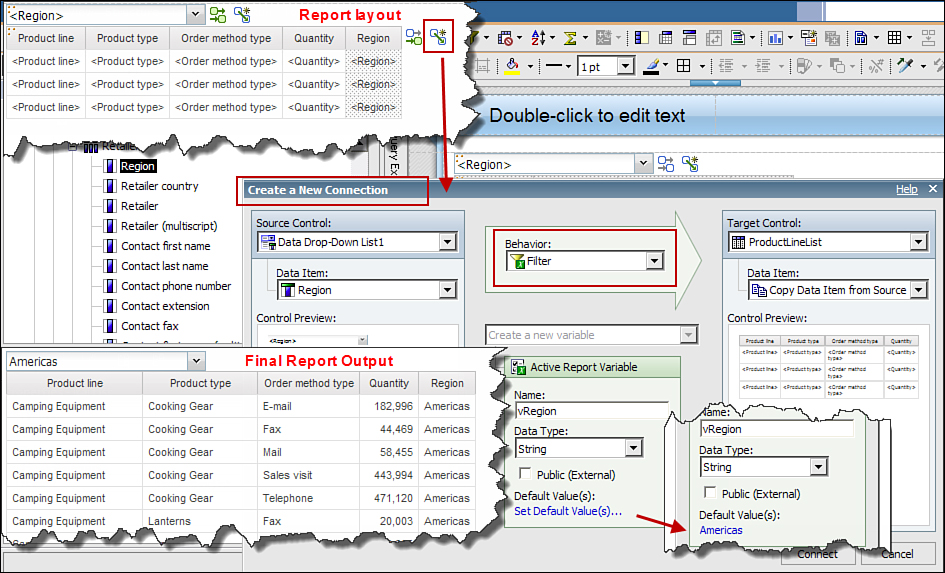
Figure 6.18. Create connection and set default value for Data drop-down list.
1. In IBM Cognos Connection, click Launch > Report Studio.
2. In the Select package window, select GO Data Warehouse (query) package.
3. In the New window, click Create New > Active Report > click OK.
4. From the Toolbox tab > drag and drop a List to the work area.
NOTE: Remember to name the List in the Properties pane > Miscellaneous > Name section.
5. From the Source tab > GO Data Warehouse (query) > Sales and Marketing (query) >Sales(query) > Products > drag and drop Product line and Product type to the List.
6. From Order method > drag and drop Order method type to the List.
7. From Sales (fact) > drag and drop Quantity to the List.
NOTE: Remember to name the Query in the Properties pane for the query.
8. From the Toolbox tab > drag and drop a Data Drop Down List to the left of the List.
NOTE: Remember to name the Data Drop Down List in the Properties pane.
9. From Retailers > drag and drop Region to the drop zone (drop item here) of Data Drop Down List.
NOTE: Remember to name the Data Drop Down List query in the Properties pane for the query.
10. Run the report.
NOTE: Selecting a value in the drop-down list does not change the data in the list. You can now create a connection between the two controls.
11. Click the Interactive Behavior icon for the Data Drop-Down List.
12. Click the Create a New Connection... link.
13. In the Active Report Variable section > Name > type vRegion.
NOTE: The Source Control is Data Drop-Down List1 and Data Item is Region. For Target Control it is List1 with Data Item as Copy Data Item from Source.
14. Change the Behavior to Filter > click Connect > click OK.
NOTE: Region data item was added to the List and appears grayed out.
15. For troubleshooting purpose you can make Region visible in the list; click Region data item in the List > in the Properties pane > Interactive Behavior section > Column Visibility > click theellipses > select Visible > click OK.
16. Run the report; test the report by selecting different values in the drop-down list; the data in the list should change accordingly.
NOTE: The drop-down list is by default empty if you do not set a default value for the variable. Click the vRegion variable in the Active Report Variables tab to set the default value, if required.
17. Change the visibility of Region data item in the list to Hidden; right-click Region in the list > selectColumn Visibility > Hidden > click OK.
18. Save the report as Product and Order Method by Region.
Hiding/Showing Columns in a Report
You can build in interactivity in the report by allowing users to hide/show columns in the report. This can be used to collapse multiple existing static reports that have similar information with subset of columns displayed. With this feature users have the flexibility to display only the relevant information for an appropriate audience without building many static reports.
Figure 6.19 outlines how to interactively hide and show columns in a report, as described in the list that follows.
1. Open the Product and Order Method by Region.
2. From the Toolbox tab, drag and drop a Table to the work area > click OK.
3. Drag and drop the List to the right cell of the table.
4. From the Toolbox tab, drag and drop a Checkbox Group to the left cell of the table.
5. Click the Check Boxes Definition icon > for Check Box Label 1 type Order method type and for Check Box Label 2 type Quantity > delete the Check Box Label 3 by clicking the delete sign (x icon on the left) > click OK.

Figure 6.19. Hide and Show columns in a report interactively.
6. Click the Check Box Group > in Properties pane > General section > Orientation > selectVertical from the drop-down list.
7. Click the Active Report Variables tab > click Create a New Variable link > in the Active Report Variables window > Name > type vColumnHideShow > click OK.
8. Right-click Order method type in the List > select Column Visibility > in the Column Visibility window > select Visible based on condition > click Edit Condition (pencil icon).
9. In Condition Comparison window > Item section (on left) > ensure Value radio button is selected > type Order method type > for Item section (on right) > Active Report Variable > selectvColumnHideShow from the drop-down list > click OK > click OK again > click OK again.
10. Repeat step 9 for Quantity.
NOTE: In the Condition Comparison window, for Quantity you must type the Quantity for Value.
11. Click the left Table cell > in the Properties pane > Font & Text section > change Horizontal Alignment to Left and Vertical Alignment to Top.
12. Click the Interactive Behavior icon for the Check Box Group > in the Interactive Behaviorwindow > Behavior on Select section > Set Variables Values > click the Edit... (pencil) icon > inSet Variable Values window > for vHideShowColumn variable > change Value to Label > clickOK.
13. In the Interactive Behavior window > Reaction Behavior section > for Container Select > click the Edit... (pencil) icon > for Data Item (on left) > select Label > for Active Report Variables > select vHideShowColumn variable from the drop-down list > click OK > click OKagain > click OK again.
14. Run the report.
15. Save the report as Product and Order Method by Region Interactive.
Drill-Through Reports
Drill-through reports work in a similar way as in a regular Report Studio report. When working with Active Reports, the source report can be an Active Report (mht) file and the target report must be a Cognos 10 report. The important thing to keep in mind is that the source report can be based on a Relational data source, a dimensionally modeled relational data source, or a Cube data source. If the source data source is Relational or dimensionally modeled relational, then the target report must be based on a Relational data source. For source reports based on a Cube data source, the target report must also be based on a Cube data source.
Figure 6.20 outlines how to create a drill through in an Active Report, as described in the list that follows. You first create a simple list report to use as the target report. You use the Product and Order Method by Region report as the source report.
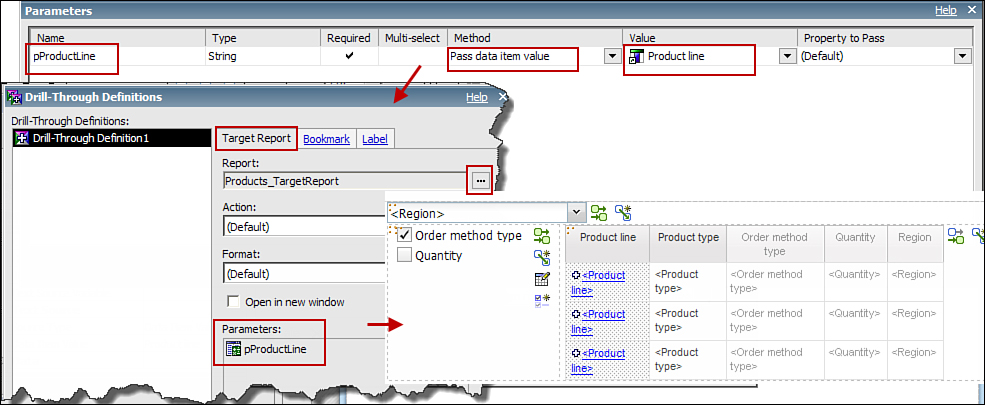
Figure 6.20. Set up drill-through in an Active Report.
1. In IBM Cognos Connection, click Launch > Report Studio.
2. In the Select package window, choose Go Data Warehouse (query) package.
3. Select Create New > List template > click OK.
4. From Products, drag and drop Product line, Product type, Product, Product description,Product color, Product size and Product brand to the List.
5. From Sales fact > drag and drop Unit Price.
6. On the Toolbar, click Filter icon > select Edit Filters....
7. On the Detail Filters tab, click Add icon (looks like bicycle gear) > select Advanced > click OK.
8. On the Detail Filter Expression window, from Products > drag and drop Product Line > at the end of the expression, type ?vProductLine? > click Validate > click OK > click OK again.
NOTE: The expression should look like this:
[Sales (query)].[Products].[Product line] = ?pProductLine?
9. Save as Product_TargetReport.
10. Open the Product and Order Method by Region report.
11. Click Product line > in the Toolbar, click the Drill-Through Definitions icon > in the Drill-Through Definitions window > click the New Drill-Through Definition icon (looks like bicycle gear).
12. In the Target Report tab (on the right) > for Report click the ellipses > locate theProduct_TargetReport you saved in step 9.
13. In the Parameters section, click the Edit... (pencil) icon > in Method column > select Pass data item value > for Value column, select Product line > click OK > click OK again.
NOTE: Product line now appears as a hyperlink.
14. Run the report.
NOTE: When you click the Product line that appears as a hyperlink, you should be taken to the Product_TargetReport, which displays the data for the selected Product line.
Bringing It All Together: Steps to Create an Active Report
This section guides you through a workshop using the different Active Report building techniques.Figure 6.21 shows the final result of the workshop.
1. In IBM Cognos Connection, click Launch > Report Studio.
2. In the Select package window, choose Go Data Warehouse (Query) package.
3. Select Create New > Active Report template > click OK.
4. Navigate to the Toolbox tab, right-click > from the menu select Active Report Toolbox Items.
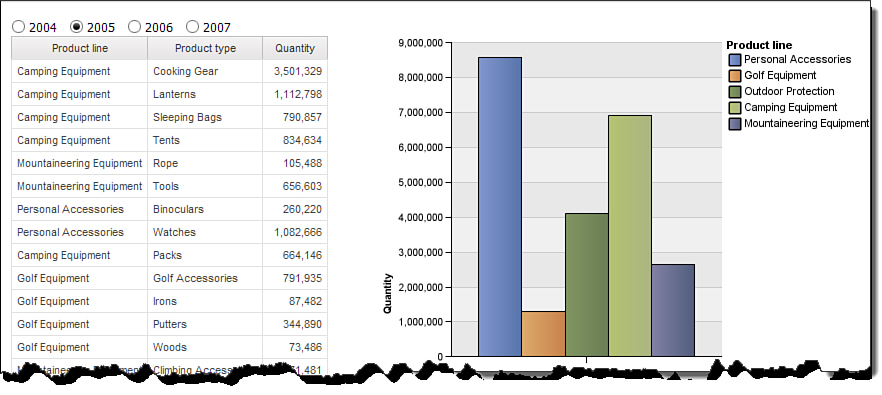
Figure 6.21. Final result for this section.
NOTE: This changes the display to only Active Report related toolbox items.
5. Locate Data Radio Button Group > drag and drop Data Radio Button Group on to the work area.
6. Navigate to the Source tab, GO Data Warehouse (query) > Sales and Marketing (query) >Sales(query) > Time > drag and drop Year data item in the drop zone (Drop item here) for Data Radio Button Group.
NOTE: This generates a radio button for each year in the Year data item.
7. Navigate to the Properties pane for Data Radio Button Group > Miscellaneous > Name, type YearDataRadioButtonGroup.
8. In the Properties pane > Data > Sorting > click the ellipses.
9. In the Sorting window, drag and drop Year in the Data Items section to the Sort List on the right > notice Year is currently set to sort in ascending order > click OK.
NOTE: Notice the two icons on the right: Interactive Behavior (left) and Create a New Connection(right). They both appear grayed out because neither has been defined yet.
10. From the Explorer bar > navigate to the Query Explorer > Query1 > Miscellaneous section > Name, type ProductRadioButtonGroupListQuery.
11. Click the Page Explorer > Page1, return to the report page.
12. On the Toolbox tab > right-click and select All Toolbox Items.
13. Right-click (hold) and drag and drop a List object below the Radio Button Group, in the work area.
14. Choose the Insert using existing query... option.
15. In the Choose Query window, select ProductRadioButtonGroupListQuery.
NOTE: The List has two options available: Interactive Behavior icon and Create a New Connectionicon. Currently they are both grayed out because neither has been defined yet.
16. Select the List object > in the Properties pane > Miscellaneous section > Name, typeProductList.
17. Navigate to the Source tab, Sales and Marketing (query) > Sales (query) > Products, Ctrl+click Product line, Product type > drag and drop it in the List.
18. From Sales fact > drag and drop Quantity, as the rightmost column in the List.
NOTE: If you run the report at this time, clicking the radio button does not change the values in the List.
Create Active Report Variable
Variables are used to store the state of the application, that is, when you select 2005 as the year; this value will be stored in the variable and will be used to drive the data in the List. This enables you to create a Filter that keeps the Radio Button Group choice and the List data in synch.
1. Navigate to the Active Report Variables tab, click the Create a New Variable link.
2. In the Active Report Variable window, type the Name, for example, varYear > click OK.
NOTE: You can specify the Data Type and Set Default Value(s)... here.
Create Connections Between Controls
When you run the report and click the different years displayed (as radio buttons), the data in the list does not change. This is the default behavior. You can now connect the data radio button group and the list so that the data displayed in the list will be for the year you select in the radio button. Figure 6.22illustrates how to define the options to create connections between the two controls.
1. Click the Radio Button Group to select it > right-click and choose Create a New Connection.
2. In the Create a New Connection window, select Source Control > YearData RadioButtonGroup is selected.
3. In the Create a New Connection window, select Behavior > choose Filter from the drop-down list.
4. In the Create a New Connection window, select Target Control > ProductList is selected.
5. Select Reuse an existing variable from the drop-down list (instead of Create a New Variable).
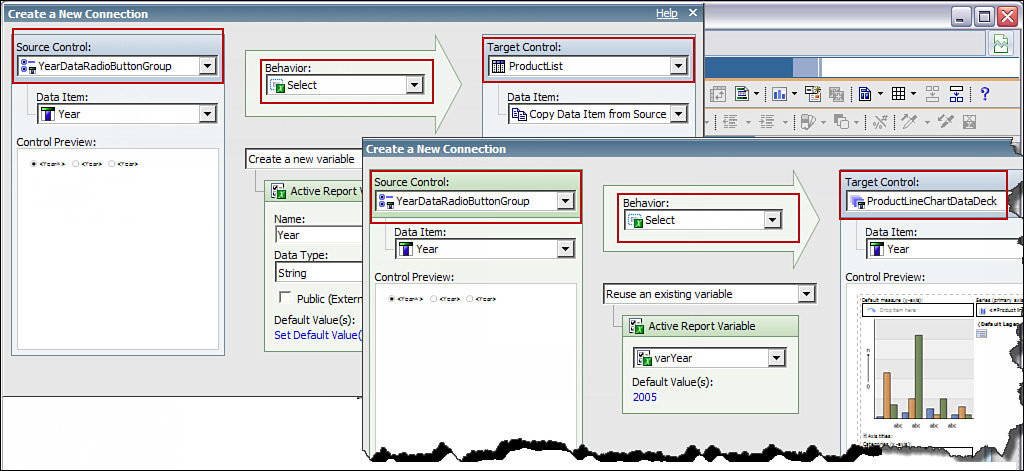
Figure 6.22. Create New Connections.
6. Click the Set Default Value(s)... link to set a default value for the YearDataRadio ButtonGroup.
7. In the Default Variable Values window, in the Values section > select 2005 > click the right green arrow to move 2005 to Selected values section on the right > click OK.
NOTE: Setting a default value ensures that the default value radio button is selected and the data in the list is displayed for the default radio button value when the report is run.
8. Click the Connect button to complete creating the connection between controls.
9. Run the report.
NOTE: Now that you have created a connection between the Data Radio Button Group and the List, when you select a different year in the radio button, the data in the List also changes.
Create Aggregation
Aggregations in Active Report are handled differently than a normal report because you want the totals to change depending on the filters you have selected in the Active Report. To do this a new option is available called Output Summary, which aggregates at the client.
1. Click the Quantity column to summarize it.
2. Click Data menu > Summarize > Summarize in Output section > Total.
NOTE: Alternatively, you can use the Summarize icon on the Standard Toolbar to summarize. Also, if you use the regular Total option from the Summarize menu instead of Summarize in Output, the totals do not change when the radio button selection changes.
Insert Chart in an Active Report
Charts in Active Reports are static; for example, the values for each combination of year and list are stored in the MHT file. You can add charts to the report by using the Data Decks. Figure 6.23 illustrates the drop location for the Data Deck.
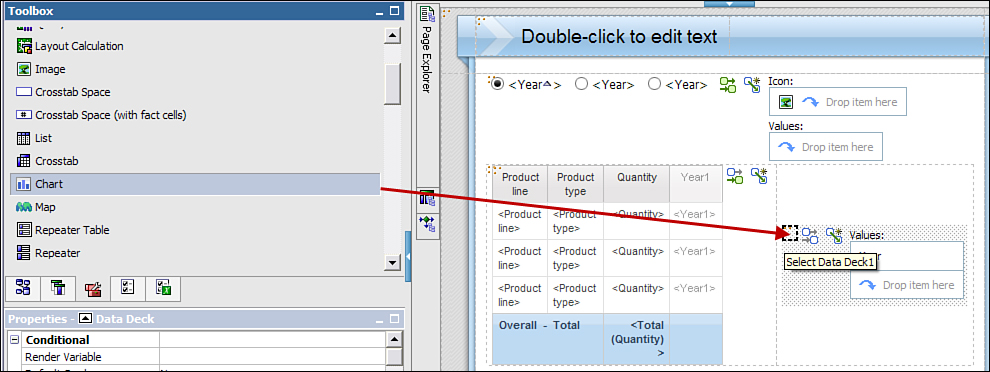
Figure 6.23. Inserting a chart in the Data Deck for the Active Report.
1. Click anywhere on the page > click the Table menu > Insert > Table > 2 columns x 1 row >uncheck Maximize width > click OK.
NOTE: The table should appear outside of the list. Click anywhere in the page first.
2. Click the List > click the Select Ancestor (or use the orange dots on top left—Select ProductList).
NOTE: You can determine the selected object via the Properties pane.
3. Drag and Drop the List in the left cell of the table.
4. Navigate to the Toolbox tab > drag and drop a Data Deck in the right cell of the table.
NOTE: The Data Deck enables you to store each chart in a card in the deck.
5. Ensure the Data Deck is selected > navigate to the Source tab, Sales and Marketing (query) >Sales (query) > Time, drag and drop Year to the Values section of the Data Deck.
6. Navigate to the Toolbox tab, drag and drop a Chart object to the Data Deck (the square with orange dots), as shown in Figure 6.23.
7. From the Insert Chart window, select the chart type, for example, Column > click OK to proceed with the default Column chart.
8. Click the Deck to select it. (Ensure the Properties pane is displayed for the Deck.)
9. Navigate to the Properties pane, Miscellaneous section > Name > typeProductLineChartDataDeck.
10. Click the Data Deck > in its Properties pane > General > Size as 400 px (height) x 600 px(width) > click OK.
NOTE: This option is required for the Slide Animation Direction option to work, as specified in the next step.
11. In the Properties pane for the Data Deck > General > Slide Animation Direction > Auto Horizontal.
NOTE: This option enables you to specify how you want the card to slide in. When you click the radio button going right, the card slides in from the right; if you choose a value on the left, the card slides in from the left.
12. Navigate to the Source tab, Products > add Product line as Series in the chart, Sales Fact >Quantity as Measure.
13. Click the Chart to select it > Data menu > Filters > Edit Filters....
14. In the Filters window > Detail Filters tab > click the Add icon (looks like bicycle gear) >Advanced radio button > click OK.
15. In the Detail Filter Expression window > Available Components pane > navigate to Sales and Marketing (Query) > Sales (Query) > Time > drag and drop Year to the Expression Definition section.
16. At the end of the expression, type =?pYear? > click OK > click OK again.
17. Click the Data Radio Button Group > right-click and select Create a New Connection.
18. In the Create a New Connection window > Source Control > asYearDataRadioButtonGroup, Behavior > as Select, Target Control > asProductLineChartDataDeck.
19. In the Create a New Connection window, choose Reuse an existing variable from the drop-down list > click the Connect button.
20. Select the chart > right-click and choose Master Detail Relationships....
21. In the Master Detail Relationships window, click the New Link button > join Year (Master section) with pYear (Parameters section) > click OK.
NOTE: Use the Master-Detail relationship to associate a deck and an object contained in that deck. It is typically used to specify what data should be shown on a card within the deck. Now when you click the Year radio button, the data in the list is displayed for that year.
22. Run the Report.
23. Download the report and use it offline.
Debugging Options
You can debug or check the variables by right-clicking in report viewer when the report displays. You can choose to view the values of the variables currently set in the report or reset the report to default values. These options are shown in Figure 6.24.
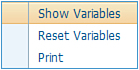
Figure 6.24. Debug options available in Report Viewer via a right-click.
The following options are available by right-clicking in report viewer to see the variables that have been set:
• Show Variables
• Reset Variables
• Print
To use this functionality, the Enable right-click debug menu check box must be selected. You can enable/disable this option from the Application bar. Click Run > Run Options... > Enable right-click debug menu. This functionality is enabled by default.
These options are not available when the report is run from IBM Cognos Connection.
Additional Active Report Properties
There are additional properties that you can set for Active Reports from the File Menu.
From here you can limit the maximum number of rows retrieved by the query for the Active Report.
Click File menu > Active Report Properties.
• Window Title: Enables you to specify a title in the report window.
• Window Startup Size: Enables you to choose from one of three radio button options: Browser default, Maximize to screen, and Fixed (Width, Height).
• Maximum query rows: Enables you to set the maximum number of rows you want to restrict in the Active Report to control the size of the .mht file (for example, 5000 [default]).
• Access code: Refer to the section on Active Report Consumption earlier in the chapter.
NOTE: The access code enables you to set a passcode for users before they can view the report. Remember, this is used to manage license compliance.
• Use as default for new active reports checkbox: When enabled, you can apply the properties to new Active Reports.
IN A NUTSHELL: REVIEWING BY IBM COGNOS BI AUDIENCE
Depending on your role on a IBM Cognos BI project implementation, you may be interested to know those aspects to use IBM Cognos Active Reports that relate to you. Now review IBM Cognos Active Reports by role at a high level.
Architect Perspective
Architects are interested in facts about application scalability and performance factors that have impact on the overall technical implementation of the BI solution. The details of how an Active Report fits in for the various user communities are highlighted in this section. There are some key points to note:
• Active Reports can either be run from within the Cognos Portal or in a disconnected mode. If consumed from within the Cognos Portal, the Active Report is secured using the security implemented in the Cognos BI environment. However, if the file is consumed outside of Cognos BI, the file must be secured using available methods for the operating system.
• The Active Report size may get large depending upon content. As a best practice, it is recommended that the file size be < 10MB. You can control the size of the Active Report by specifying the maximum number of rows in Active Report properties in Report Studio.
• Charts tend to make Active Reports large because the output contains an image of all possible iterations of the chart. If the report is not carefully designed, the report output could be large and negatively impact the report performance.
• If the file size is expected to exceed the file size limit allowed to be emailed, consider emailing the link to the report. In this case the users must have access to the Cognos BI environment. Alternatively, you can store these on a shared network drive from where authorized users can access the report.
• Active Reports can be scheduled and distributed just like a PDF or other report outputs supported by IBM Cognos BI.
• Active reports can be consumed by Internet Explorer V7.0 or higher or Firefox V3.6 or higher. Users using Firefox require the UnMHT plug-in.
• All the Active Report information is stored within MHT file, that is, all processing has already been done within the browser, and it does not consume resources on the BI server when run in a disconnected mode.
Project Manager Perspective
Project Managers are interested to know what tasks and resources are required to fulfill the Active Report requirements. Here are some points to consider:
• The resources required for implementing Active Reports requirement are Framework Manager metadata modeler and Report Studio report developer. To build Active Reports the metadata model must first be published to the IBM Cognos BI portal. After the package has been published, the Report Studio report developer can start developing Active Reports.
• Active Reports can be either run from the IBM Cognos BI environment when connected to the Cognos BI server or in a disconnected mode by downloading the report Active Report MHT files that require Internet Explorer v7.0 or higher or a Firefox unMHT plug-in.
• Active Reports are designed for end users who require enhanced interactivity in the report. Unlike PDF outputs that are static in nature, Active Reports have filtering and sorting capabilities that enable the end user to continue to analyze data.
• The knowledge of how Active Reports will be consumed, that is, from within the IBM Cognos BI environment or disconnected mode, can guide you to ensure that the appropriate licenses are available.
Business Analyst Perspective
Business Analysts may want to focus on the requirements for Active Reports and a business case. Although Active Reports provide a high level of interactivity, it may not be the right answer for everybody. You must understand the audience and their needs and recommend Active Reports as a solution based on these findings. Some of the key requirements to gather and points to consider follow:
• What are the reporting needs of the different users of IBM Cognos BI? How is it currently satisfied in the existing environment? The answers can enable you to gauge if there are users who require using reports in a disconnected mode and making decisions based on BI data.
• Active Reports are a good fit for the C-level users, sales force team, and business users who need to make decisions wherever they are and base their decisions using BI data.
• The key feature of Active Reports is the filtering and sorting capabilities while disconnected from the server. During the requirements gathering phase, you must capture filter requirements. Several filter types are available when building Active Reports; it is a good idea to work with the customer and identify the best-suited type for their reporting needs, for example, check boxes or radio buttons.
• Similar to the needs of building a Report Studio report, Active Reports are built using Framework Manager packages. You must ensure that the data required to build the Active Report is communicated to the metadata modeler and is made available for reporting.
• Active Report is built using Report Studio; all the capabilities available in Report Studio are available when building an Active Report. Active Reports have additional interactivity available in them.
• Because Active Reports can be consumed in a disconnected mode, that is, disconnected from the BI server, you must have a process in place that ensures the MHT files can either be downloaded directly by users from the Cognos BI environment or can be scheduled and emailed.
• Active Reports contain data that has been already processed and hence can get large in size resulting in sluggish behavior. You must understand that more is not always better! You must understand the reporting needs and carefully guide the customer to build efficient Active Reports.
• Large Active Report may not be allowed through the organization’s email server because many organizations limit it to a certain file size. In such cases users can either be emailed the link to the report that they can download from the Cognos BI server directly or the Active Reports can be stored in a shared network drive.
• It is recommended you work with the Cognos BI Architect and the Project Manager to ensure that the Active Reports consumption modes and available licenses match to fulfill the requirements.
Developer Perspective
Developers refers to the Cognos development team. Here are some thoughts as a starting point as you build the Active Reports:
• It is not uncommon that the requirements captured are feasible however not efficient. When such a situation arises, you must work closely with the Cognos BI Architect, Cognos BI Administrator, and Business Analyst and share alternatives that result in a better outcome.
• Wherever applicable as a best practice, consider building an Active Report from an existing report.
• When run from within the Cognos BI environment, Active Reports can use the existing security in the Cognos BI environment; however, you must understand if there are any expectations for securing the MHT file. Work with the IBM Cognos BI Architect and Business Analyst to ensure a suitable solution is available that can be implemented using the existing infrastructure.
• Active Reports can be scheduled and distributed in the same way as any other report in an IBM Cognos BI environment.
End-User Perspective
End Users benefit from understanding the capabilities of Active Reports to tap into its benefits. It is a good idea to request for Product demo if you are not familiar with the product or have never seen it before. Some of the things you should think about, as a starting point, are listed here:
• Do you require the ability to analyze data when disconnected from the Cognos BI server? If yes, then Active Reports is a suitable choice to address those reporting needs.
• Are there users in the organization who can benefit from your sharing a standalone file with related data all in one place to support their analysis? If yes, you can email these files and share with your peers or partners who may not have access to the Cognos BI environment.
• Are you or anyone in your team required to analyze data in reports that provide a high level of interactivity? If yes, Active Reports maybe a suitable choice.
• Active Reports store all the information you need for the analysis within the MHT file and can easily get bulky resulting in sluggish performance. You should prioritize the requirements for the Active Reports. As a best practice it is recommended that the file size be <10MB.
• Active Reports are powerful option for reports that require high level of interactivity and are dashboard style.
IBM Cognos BI Administrator Perspective
IBM Cognos BI Administrators are interested in keeping an eye on the reports that can impact server performance and availability. Active Reports are to be treated like any other reports in IBM Cognos BI environment. Some of the points worth considering follow:
• Are there any requirements for Active Reports? If yes, what would be their estimated size?
• What are the expected ways to consume these Active Reports? Will they be consumed from Cognos Connection or are there requirements for scheduling and distributing them?
• If the Active Report requires distribution, will the file size be within the limits permitted by the organization’s file limit size?
• Is it expected for the Active Report to be stored in a shared location, for example, a shared network drive? Does the Cognos Server have access to it?
• How often does the Active Report need to be refreshed, distributed, or uploaded to the shared network drive location?
I really appreciate information shared above. It’s of great help. If someone want to learn Online (Virtual) instructor lead live training in Ibm Cognos, kindly contact us http://www.maxmunus.com/contact
ReplyDeleteMaxMunus Offer World Class Virtual Instructor led training on Ibm Cognos. We have industry expert trainer. We provide Training Material and Software Support. MaxMunus has successfully conducted 100000+ trainings in India, USA, UK, Australlia, Switzerland, Qatar, Saudi Arabia, Bangladesh, Bahrain and UAE etc.
For Free Demo Contact us:
Name : Arunkumar U
Email : arun@maxmunus.com
Skype id: training_maxmunus
Contact No.-+91-9738507310
Company Website –http://www.maxmunus.com
Hi,
ReplyDeleteReally very nice explanation.Keep updating more blogs.
cognos tm1 traing
learn cognos tm1
cognos tm1 online training