IBM Cognos Workspace
IBM Cognos Workspace is a new web-based interface in IBM Cognos BI v10.1 that enables business users to consume, interact, and collaborate—all from a single, unified workspace. Cognos Workspace was named Business Insight in Cognos v10.1.1 in prior releases. Cognos Workspace introduces this concept of a Unified BI Workspace or the dashboard canvas, which refers to the users’ work area in Cognos Workspace. You build your dashboards and reports in the workspace by using your existing Cognos BI content, for example, reports, analyses, TM1 cubes, metrics from Metric Studio, Real-Time Monitoring content, and so on. Cognos Workspace enables you to easily and quickly assemble a workspace without IT interaction and share your report or part of report with others via email. The self-service feature of Cognos Workspace enables you to consume the existing trusted Cognos content via easy drag-and-drop capability to build an interactive workspace. You can launch Lotus connections from within Cognos Workspace and start collaborating with your peers, team, and others to facilitate decision making.
There are three key features of Cognos Workspace:
• Easy Assembly and Formatting capabilities: The WYSIWYG feature enables business users to see how the report will look as they assemble it, without needing to run it to see the report output. You can easily and quickly create your reports and dashboards by dragging and dropping IBM Cognos BI content into your unified workspace and create any such versions of the report without requesting the one-off reports from IT. You can easily move your widgets around in the unified workspace, convert a chart into a report, and so on. You can switch from one chart type to another, change the color palettes of your report, group/ungroup data in your report, resize the widgets and move them around, and so on.
• Interact and Analyze: You can easily perform analysis using your dashboard, by drilling up or down the data, adding filters and calculations to narrow your scope of analysis, and sorting the data in an order that is meaningful to you. If you want to further analyze the data, you can glide into Cognos Workspace Advanced via the Do More... button. After you finish using Cognos Workspace Advanced, you can glide back to Cognos Workspace using the Done button.
• Share and Collaborate: You can add comments in reports or report widgets as well as on a cell or data item in your List/Crosstab report. Adding comments enables you to either ask a question to a team member or add comment to note your findings and share with others. You can also share the report with others by exporting the content to a PDF, Excel, CSV, or XML file and collaborate using Lotus Connections. Lotus Connections is social software for business that provides organizations a collaborative work environment. It enables you to harness the collective intelligence of the organization by easily connecting employees, business partners, and so on.
COGNOS WORKSPACE AUDIENCE/USERS
Cognos Workspace is best suited for business users who focus on data analysis or quickly pull together reports to answer ad-hoc business questions without depending on IT. It is ideal for business users who spend time working with self-service dashboards while connected to the Cognos BI server or who need to create their own reports/dashboards and collaborate results using the corporate security defined in the IBM Cognos BI environment.
If you have been using Query Studio, Go!Dashboard, Go!Search, and Portal Pages in IBM Cognos 8, you should consider using Cognos Workspace. This can enable you to use the new additional enhanced capabilities available in addition to the ones you may be currently using in Cognos 8. For such usersCognos Workspace is the logical and recommended component in IBM Cognos BI v10.x.
Query Studio features in Cognos Workspace include quick drag and drop of items to answer your questions, whereas also leveraging the drill up/down features you used in Query Studio.
Go!Search features are bundled into Cognos Workspace as Search Assisted Authoring. It is no longer a separate product. The search capability enables you to also search annotations and Lotus Connectionsdashboard activities.
Go!Dashboard features available in Cognos Workspace include the ability to add comments at the cell level; comments at a report widget level; change display type; change color palette; drill up/down; export to PDF, Excel, CSV, and XML; print to PDF; resize and move widgets; sort tables and crosstabs; and use prompts.
Portal Pages (which is commonly used in Cognos 8 to create pages where you show similar content, for example, reports/objects together) can now be assembled as different widgets in the unified workspace.
The options available to you in the workspace are determined by the permissions you have been assigned by the IBM Cognos BI Administrator. Generally speaking, there are three levels of access that can be assigned to the workspace.
• Assemble: This category of users has permission to author reports. They can access all functions and features in Cognos Workspace, as listed in Table 8.1.
Table 8.1. Three Categories of Workspace Features and Functions Available to the Users
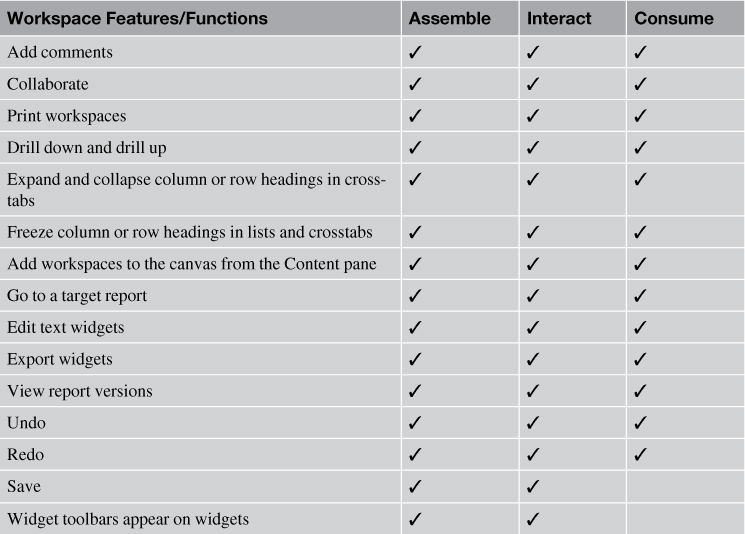
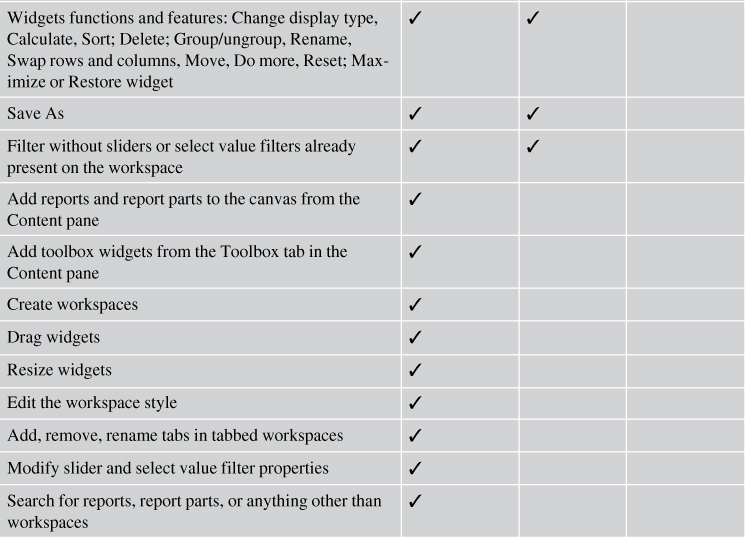
• Interact: This category of users can interact with the widget data through the widget toolbar. These users have access to only a subset of features available to the Authors category. These users can swap rows and columns, change the report display type, and so on.
• Consume: This category of users can view and print the workspaces, drill up and drill down the workspace data, and so on.
Table 8.1 highlights the features available to these three categories of users.
For more information on how to set up permissions, refer to the section, “Global Capabilities for Secured Functions and Features,” in Chapter 12, “Securing IBM Cognos BI Environment and Its Objects.”
COGNOS WORKSPACE USER INTERFACE
You can launch Cognos Workspace using one of the following ways:
• From the Welcome Page of your IBM Cognos BI environment
• Using the Launch option in IBM Cognos Connection
• Using the Create a New Dashboard in Cognos Connection toolbar
• Directly from a web browser by typing in this URL: http://machinename/ibmcognos/cgi-bin/cognos.cgi?b_action=icd; validate with your Cognos Administrator for the exact link
• Clicking the link of existing dashboard in Cognos Connection
• Clicking the name of a dashboard in the Search results
Depending on the method you use to open Cognos Workspace it may open in one of the two modes:
• Chrome: Includes the toolbar and menu of the web browser. This mode is available to you only when you directly type in the URL in the web browser.
• Chromeless: Does not show you the toolbar and menu of the web browser. This mode is available when you open Cognos Workspace using any other method but typing the URL in the browser directly.
When you first launch Cognos Workspace, you are brought to the Cognos Workspace Getting Started page, as shown in Figure 8.1. From here you create a new dashboard; open an existing dashboard; quickly access your frequently used dashboards via Favorites; and use How-to Videos for quick help on a feature in Cognos Workspace. If you choose to create a new dashboard, you will be brought to an empty dashboard canvas, also referred to as the Cognos Workspace unified workspace. Use the workspace to build your dashboard.
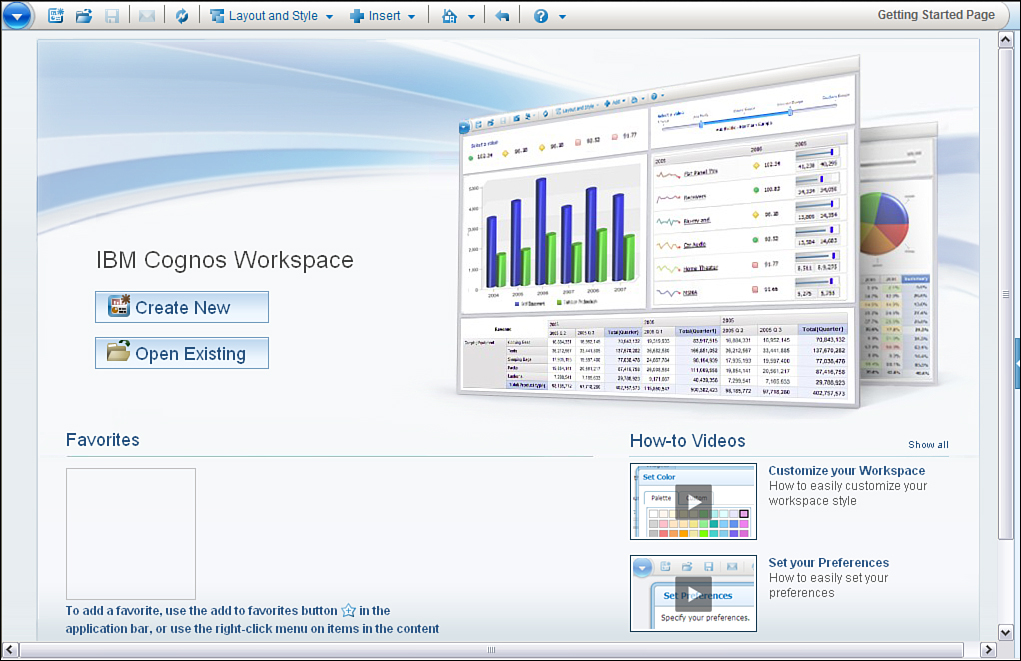
Figure 8.1. IBM Cognos Workspace Getting Started page.
The Application bar contains icons for actions you frequently perform. Figure 8.2 highlights theCognos Workspace workspace options.

Figure 8.2. IBM Cognos Workspace user interface.
Figure 8.2 shows a Cognos Workspace unified workspace with five different widgets including the slider filter widget. The Application bar provides buttons that control basic dashboard functionality and the individual widgets. Each option from Figure 8.2 is explained in the sequence as shown in the figure.
1. Actions Menu: This menu provides some of the options available to you on the Application bar. The options available on the Actions menu are Create new workspace, Open an existing workspace,Save this workspace, Save as, Email Link..., Copy Link to Clipboard, New Tab, Rename This Tab,Remove This Tab, Order Tabs..., Edit Workspace Style..., My Preferences..., Log On..., Log Off,Launch any of the following applications: Metric Studio, Cognos Workspace Advanced, Query Studio, PowerPlay Studio, Analysis Studio, Report Studio, Event Studio, Drill Through Definitions, IBM Cognos Connection, IBM Cognos Administration (options available depend upon your security permissions in IBM Cognos BI environment), Refresh Workspace, and Exit.
2. Create a new workspace: Use this icon to create a new Cognos Workspace workspace with your reports, charts, or other dashboards. When you click this icon, an empty workspace opens. You can drag and drop items, for example, reports and dashboards, from the content pane and build your workspace.
3. Open an existing workspace: Use this icon to open an existing workspace in Cognos Workspace. When you click this icon, you are presented with the Open window with two folders: Public Folders andMy Folders. You can navigate to the appropriate location and click the Open button to open the workspace.
4. Save this workspace: Use this icon to save your workspace for future use or to share with others. When you click the Save icon on the Application bar, the Save As window displays for a freshly created workspace. You must provide a valid name for your workspace, and click the Save button to save your workspace. For an existing workspace, any updates to the workspace are saved. Remember, if you save it in My Folders only you have access to the workspace. However, if you want to share it with others, you should save it in Public Folders or in a shared location provided by your IBM Cognos BI Administrator.
5. Email Link...: Use this icon to email the workspace link to others. You must first save the workspace before you can email its link (URL) to others.
6. Collaborate: You can create activities using Lotus Connections, assign to-do items, share files, post comments on workspace items, and leverage other social software capabilities such as wikis, blogs, communities, and so on to collaborate with others.
7. Refresh: Use this icon to refresh all the widgets in your workspace; this syncs up the workspace with any recent data updates in the data sources.
8. Layout and Style: You can customize the appearance of your workspace by changing the background among other items. The drop-down provides three options: Fit All Widgets to Window,Arrange All Widgets to Fit Content, and Edit Workspace Style.... In the Edit Workspace Style... option, you have two tabs: Page and Widgets. The Page tab enables you to specify the background for the whole workspace to a specific color or an image. Navigate to the Widgets tab, and notice that from here you can change the appearance of all the widgets in the workspace. For example, you can change the color, show titles, change the font type/size, and define borders color, style, and width.
9. Insert: Enables you to add a dashboard object, for example, content or toolbox items from theContent pane to your workspace.
10. Home: Enables you to return to your home page or set a workspace as your home page. The Home page is usually a workspace that you frequently use.
11. Help: Invoke help on Cognos Workspace and other Cognos products via documentation and how-to training videos.
12. Favorites: Enables you to add/remove workspaces from your favorites. By clicking on this icon on the Application bar, you can add the currently opened workspace to the list of Favorites. To add a report to your Favorites, right-click the report name in the Content pane, and choose Add to My Favorites. You can access the workspace and reports you added to Favorites from the Content panedrop-down; then choose My Favorites.
13. Name of currently opened workspace displays.
14. Content: This option exists in versions prior to Cognos BI v10.1.1. The Content button on theApplication bar acts as a toggle that hides/shows the Content pane. The Content pane contains the IBM Cognos content and the tools you need to create your dashboard.
15. Search: IBM Cognos Search has been incorporated into Cognos Workspace. This enables you to search for content and add it from within the application. Use this icon to quickly search a report or report item in your existing Cognos content. You can perform searches like any other search engine. A search index must be created by your IBM Cognos BI Administrator before you can use this option.
16. Refresh: Use this option to refresh the contents displayed in the Content pane. This refreshes only the Content pane when new content is available in your IBM Cognos BI environment to which you have permissions.
17. Show/Hide Information Card: This icon is a toggle to hide or show the information card. The information card provides you additional information on a dashboard, report, or report item. The information card displays the item name for which you requested an information card, name of the person who owns the entry (for example, Mary Miller), the contact person for this entry (if it has been set up), date the entry was last modified, and the location of the entry (for example, Public Folders).
18. Thumbnail View: Clicking this icon displays a thumbnail for each entry in the Content pane.
19. List View: Clicking this icon displays the items in the Content pane in a list form (for example, the name of the entry and date modified).
20. Tree View: Clicking this icon displays a hierarchical tree view of entries in the Content pane. This is the default view for the Content pane.
21. New Folder: Clicking this icon enables you to create a new folder in the Content pane and provide it a name.
Content Pane
The Content pane displays the reports and dashboards you can add to your workspace. In addition, it contains the Content pane filter that enables you to set a location scope from where to display the content. By default it shows All Content, which displays both Public Folders contents and My Folderscontent (refer to Figure 8.2). You can change the scope of content displayed in the Content pane by using this filter to change the display scope to My Folders, My Favorites, or All Content. If you had performed any search, your successful search result scope is also listed (for example, Search Results for SampleOutdoor); otherwise this option is not available. In My Folders, you can find content that can be accessed by you only, whereas My Favorites has all the workspaces you added to your Favorites for quick access. You can see only the Cognos content to which you have permissions access to.
In the Content pane you also have the options to refresh, show/hide an information card, and change the display type to thumbnail, list, or tree view (discussed as items 16-20 in the section “Cognos Workspace User Interface” earlier in this chapter). You can reposition the Content pane to the left of the workspace; by default it appears on the right.
Refer to Figure 8.2 to see the toggle show/hide Content pane. Hide the Content pane when you need more workspace by clicking the little triangle icon for show/hide Content pane. You can also show/hide this pane by clicking Content (refer to option 14 in Figure 8.2) in the Application bar, if you work with versions prior to IBM Cognos BI v10.1.1.
At the bottom of the Content pane are two tabs: the Content tab and the Toolbox tab (refer to Figure 8.2). The Content tab contains the reports, workspaces/dashboards, and other Cognos content that you can add to your workspace by dragging and dropping the objects onto the workspace. You can also right-click an object in the Content pane and choose Insert to insert it. Or select the option Open in a new workspace to open in a new workspace.
You can use additional widgets from the Toolbox tab and add them to the workspace (for example, filters and other widget types). You can add a Slider Filter or Select Value Filter to filter the workspace or report content that enables users to change the scope of data they want to analyze. In addition, you can choose from the Toolbox tab other types of widgets and add content such as Web Page, Image, My Inbox, Text, or RSS Feed.
Tabbed Workspace
You can add tabs to the workspace to organize its content, as shown in Figure 8.3. These tabs may reflect different aspects of the business in the same workspace (for example, Human Resources, Marketing, and Finance) or the same data being displayed in different ways in different tabs.
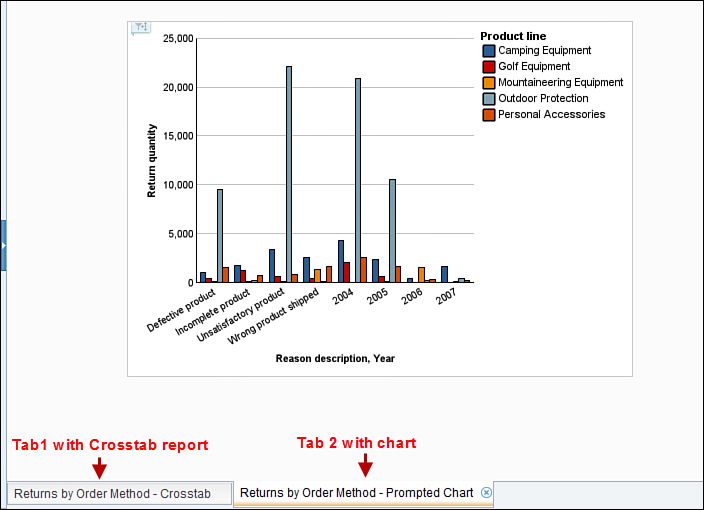
Figure 8.3. Working with tabbed workspaces.
You can navigate from one tab to the other by clicking on the tab you want to view. You can add, rename, delete, or change the order of the tabs in the workspace using the options available on theActions menu.
The following options are available to you from the Actions menu:
• New Tab: Add a new tab to the workspace via the Actions menu or by right-clicking. Each time you add a tab, the default tab name appears as Tab1, Tab2, and so on, incremented automatically.
• Rename This Tab: You can provide meaningful names to each tab by selecting the tab first and then using the Rename This Tab option from the Actions menu or by simply double-clicking the tab and typing in a new name in the Rename box.
• Remove This Tab: Remove any unwanted tabs from the workspace via the Actions menu or by right-clicking the tab and selecting Remove.
• Order Tabs...: This option enables you to modify the sequence in which the tabs appear in the workspace. You can modify the tab sequence via the Actions menu > Order Tabs... option or by right-clicking anywhere in the workspace and selecting the Order Tabs... option. When you select theOrder Tabs... option, the Order Tabs window appears, which lists all the tabs in the currently opened workspace. You can click the tab in the list and move them up or down the list via the Top/Up/Down/Bottom arrows on the right side of the window.
Global Area
The Global Area holds objects that are common to all the tabs (for example, Filters and Prompts), as shown in Figure 8.4. You can add Slider filters, Select Value filters, report parts (for example, Prompts) and Action buttons. You can add content to the Global Area by dragging and dropping objects from theContent pane or the Toolbox tab. Alternatively, you can right-click the object you want to add to theGlobal Area and select Insert in Global Area; however, you cannot drag and drop objects from the tab to the Global Area or from the Global Area to the tabs.
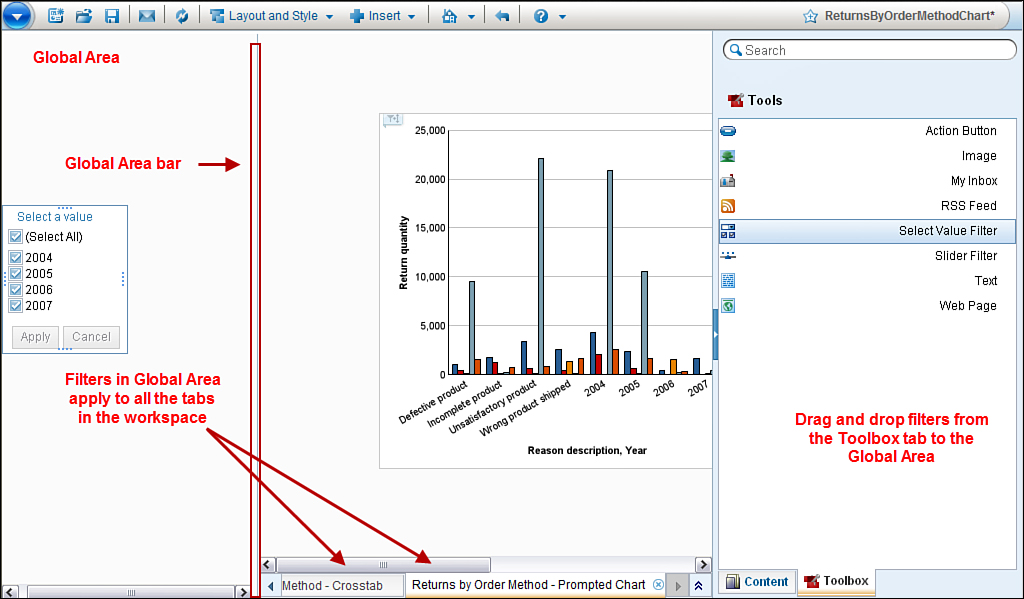
Figure 8.4. Global Area high-level interface.
The Global Area appears collapsed opposite to the Content pane on the left. You can click the arrow icon in the bar to expand the Global Area.
You can resize the Global Area by first expanding it and then dragging the Global Area bar to the left or right, as required.
Information Bar
Every widget on the workspace has an Information bar displayed on the top left of the widget, as shown in Figure 8.5. By default, the Information bar is always collapsed, which you can expand by clicking the Information bar. Clicking anywhere on the Information bar header or the Information bar icon on the left collapses it again. The Information bar contains filter and sort information that is currently applied to the report in the widget. The filters displayed can be filters from a Slider filter, Select Value filter, or filters applied through IBM Cognos BI studios or through prompted report objects. You can remove a filter from the widget only if it has a delete (X) icon on the right side of the filter. Those filters that were applied outside of Cognos Workspace show grayed out or with a lock. You cannot delete these filters.
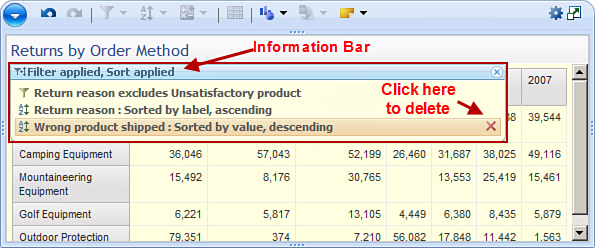
Figure 8.5. Information bar displaying the applied Filter and Sort applied to Returns by Order Method.
Similarly, you can see in the Information bar the sort conditions that have been applied to the widget report. The sort conditions can be those that were applied from within Cognos Workspace by using the widget sort options or may have been sorted by the reporting tool outside of Cognos Workspace. Similar to filters, you can remove the sort condition only if has a delete (X) icon on the right side of the sort condition.
The Sort and Filter conditions are included in the report when the report widget is printed or exported to Microsoft Excel 2007 or PDF.
Widget Actions Menu
Every widget has a Widget Actions menu that provides options specific to that widget only. The Widget Actions menu becomes visible and available only when you click the widget and bring it to focus. Refer to Figure 8.2 to see that the Widget Actions menu is only visible for the chart Correlation between Region and Products at this time. Some of the options available to you in this menu are Remove from Workspace, Print as PDF, Export to PDF, Excel 2007, Excel 2002, CSV or XML, Versions, Refresh,Prompt Again, Reset, Listen for Widget Events, Resize to Fit Content, Send to Back, Do More..., andProperties.
You explore these options in greater detail later in this chapter.
On Demand Toolbar
Every widget has an On Demand toolbar with an Actions menu that becomes available and visible for the currently selected widget (refer to Figure 8.2). The options available in the widget vary depending upon the type of widget.
Explore Application Bar Options
Additional options are available to you from the Application bar. Some of the actions in theApplication bar are also available to you from the Actions menu. If you have Lotus Connectionsconfigured in your environment, an icon will be available for collaboration. The sections that follow explore these options in more detail. The options are covered in the sequence they appear on theApplication bar.
New Workspace
Use the New Workspace option to create a new Cognos Workspace workspace:
1. On the Actions Menu, click the New Workspace icon.
2. In the Content pane on the right, navigate to Public Folders > SampleOutdoor Reportsfolder > Product Forecast > List1 report part.
3. Drag and drop List1 on to the workspace.
NOTE: If you have not performed the activities in previous chapters, you may not have a folder SampleOutdoorReports and Product Forecast report. You may navigate to Public Folders >Samples > GO Data Warehouse (analysis) > Report Studio Report Samples > Customer Returns and Satisfaction > List1.
Open
Use this option to open an existing Cognos Workspace workspace.
Save
Use this option to save your workspace.
Email Link
You can email the link to your workspace to others in your organization. Users must have permissions to view the workspace. When you click the option Email Link... icon, the link to the workspace is automatically pasted in your default email client with the workspace name in the subject line, as shown in Figure 8.6.
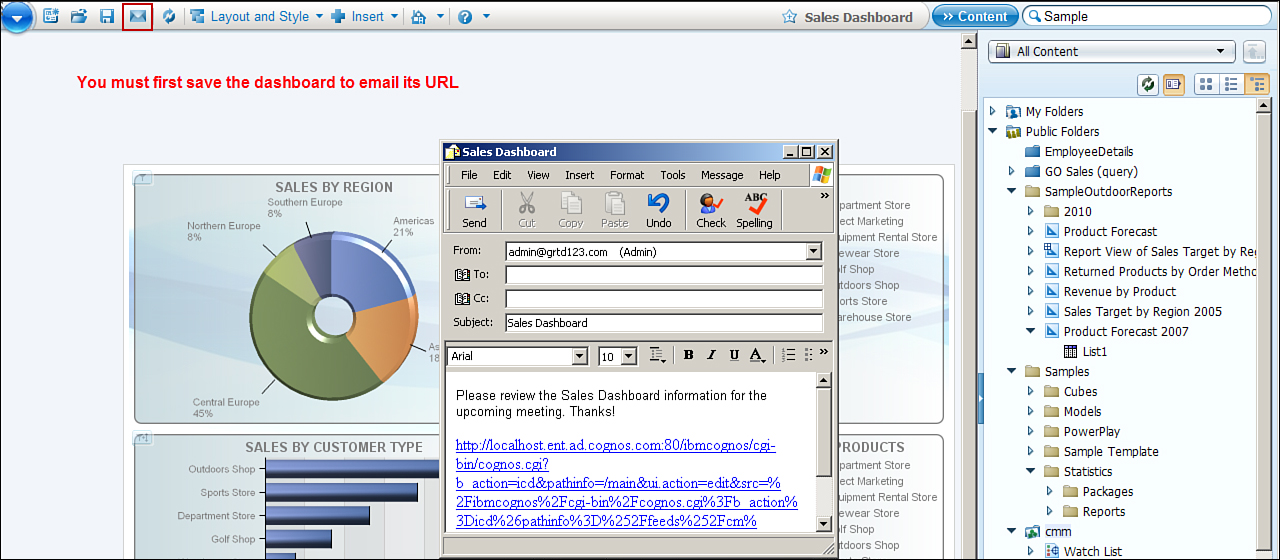
Figure 8.6. Email Sales Dashboard via IBM Cognos Workspace.
Collaborate
You can launch Lotus Connections from Cognos Workspace and collaborate with others.
This option appears as a drop-down list and in the Application bar and provides two options:
• Start an Activity
• View/Hide Dashboard Activities
The Collaborate option enables you to create activities using IBM Lotus Connections. Activities enable you to create and assign to-do items, post messages, and share files. You can also use other social software capabilities such as wikis, blogs, and communities to collaborate with others.
Start an Activity
Use the Start an Activity option to create an activity for the workspace. The Start an Activity window opens requesting a userid and password. When successfully logged on, you can accomplish the following:
• Start creating your activity.
• Give your activity a name.
• Describe the goal of the activity.
• Provide tags for easy search.
• Activity due data.
• Include the list of people you want to work with on this activity and identify them as owner, author, or reader in the Member options.
You can search for people while including people in the activity. When the person with the name you were searching for is found, a name card becomes available with the details of the person. Use this to ensure you are selecting the correct Mary Miller if there are multiple people with the same name in your organization. There are some templates already available to use rather than creating your own. Typing in the template name searches for templates with similar names and narrows your search list. However, you may opt not to use it if you do not want to do so. After you have assigned the activity to other people, they can see the activity in their to-do list.
To start an activity, click the Collaborate icon on the Application bar, and choose Start an Activity. When you create an activity, you can specify an activity title, activity goal, tags, due date, and specify members to be owner, author, or reader, and so on.
When you click Save, the browser for Start an Activity displays. All the activities that you have access to are listed as shown in Figure 8.7.
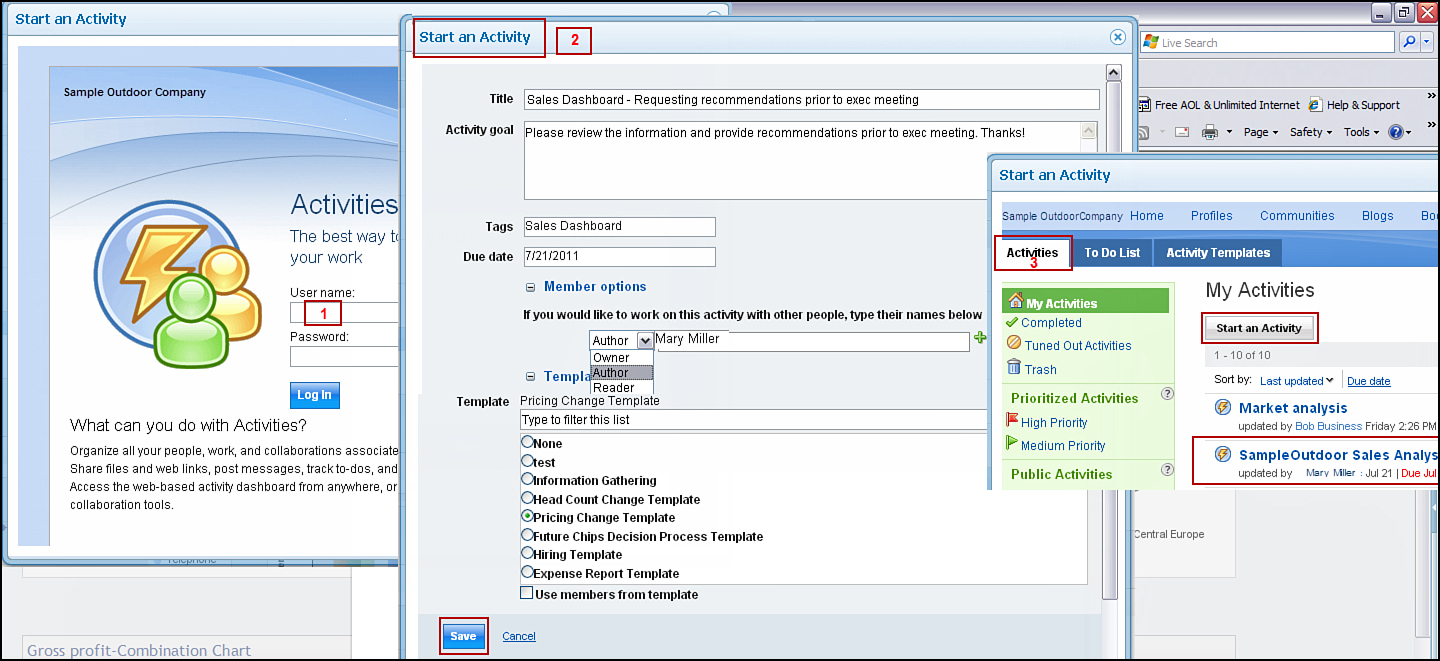
Figure 8.7. Collaboration Options – Working with Activities in Lotus Connections.
In addition, you can leverage work with other social collaboration features such as blogs, files, and wikis to explore and enhance your recommendations and findings by working as a team together.Figure 8.8 shows additional options available to you, for example, Profiles, Communities, Blogs, andBookmarks that you can use for collaborating with others.

Figure 8.8. Collaboration Options – Lotus Connections options and interface.
Figure 8.9 shows that the View/Hide Workspace Activities option works as a toggle. Choosing this option once shows you all the activities that have been defined on this workspace in the Workspace Activities pane, at the bottom of the screen. Choosing this option again hides the Activities pane from the bottom of the screen. You can also see the activities generated by other users. In Lotus Connections, you can see the activities you have access to, not just the ones associated with the currently opened workspace. You can click the activity for more details. In the Activities pane there is a link to the workspace.
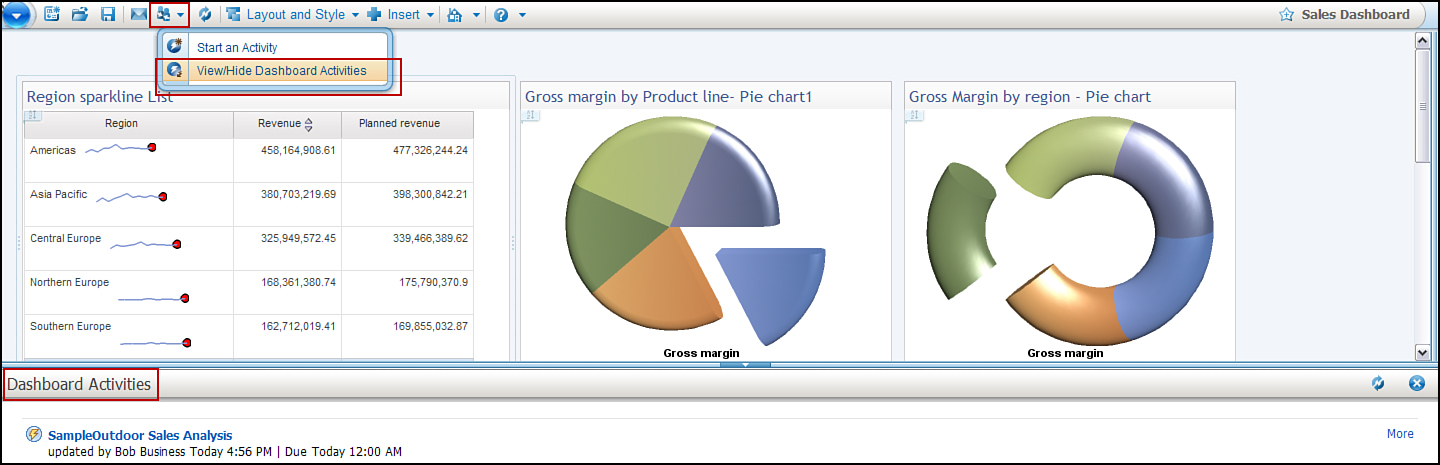
Figure 8.9. View all workspace activities set up via IBM Cognos Cognos Workspace.
Later you see that you can also collaborate with others by adding comments and annotations to reports.
Refresh Workspace
The Refresh All option from the Application bar refreshes all workspace content. Every widget in the workspace will be refreshed.
NOTE: To refresh the content of an individual widget, use the Refresh option from the Widget Actions menu.
Edit Workspace Style...
The Edit Workspace Style... option enables you to modify the workspace style, that is, background color of the workspace and widget properties. Cognos Workspace provides free form layout with gridlines to help you align the widgets. As you move the widgets in the canvas, you notice the gridlines appear horizontally and vertically, and can use them to align your widgets in the workspace canvas.
There are three options available to you from here:
• Fit All Widgets to Window
• Arrange All Widgets to Fit Content
• Edit Workspace Style...
The sections that follow describe these options in more detail.
Fit All Widgets to Window
When you drag and drop items from the Content pane into your workspace, the widgets are automatically sized to fit the content within them. When you use this option, all the widgets on your workspace are resized to fit the current browser window. Depending on the number of widgets on the workspace, scroll bars may appear in the widgets where appropriate.
To fit all widgets to a window, you must first click the Layout and Style icon on the Application bar, and then choose Fit All Widgets to Window.
Arrange All Widgets to Fit Content
Use the Arrange All Widgets to Fit Content option to fit all the content of the report part into the widget. All widgets are rearranged to avoid overlapping of widgets. Depending on the number of widgets and their size, some of them may have scroll bars where appropriate. You can also accomplish the same thing via the Resize to Fit Content option in the Widget Actions menu. To arrange all widgets to fit content, click the Layout and Style icon on the Application bar, and choose Arrange All Widgets to Fit Content.
Edit Workspace Style...
The Edit Workspace Style... option has two tabs: one for Tabs and Global Area settings and the other for Widget properties, as shown in Figure 8.10.
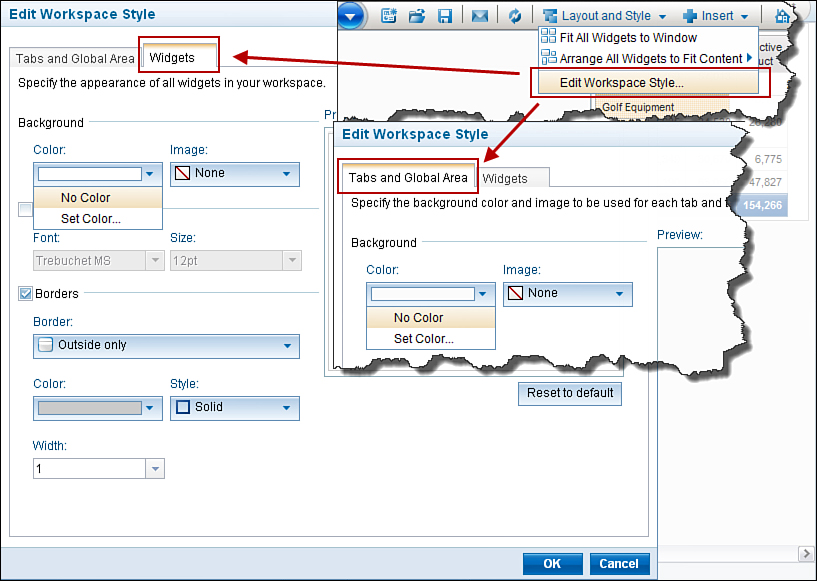
Figure 8.10. Edit Workspace Style options – Tabs and Global Area and Widgets options.
On the Tabs and Global Area tab, you can define the background of the workspace by changing thebackground color or background image. For a page color, you can choose from None or Set Color.... in the drop-down list. Clicking the Set Color... option brings up the Set Color window, which enables you to choose a Palette color or a tab to define Custom color. Custom color requires that you provide a color value as a named value or hexadecimal value.
By default the background image for the workspace page is set to None. If you want to use an image as background for your workspace page, in the Image setting, click the drop-down. From the two options in the drop-down list (No image and Set image...) click Set image...,. This brings up the Set Imagewindow. In the Set Image window, you must type the image URL address, ashttp://www.server_name/image_path/image.gif. The path specified must point to an administrator approved domain. When working with images, you can also specify the Tiling and Position options. Choose from one of the Tiling options:
• Tile in Both Directions
• Tile in Horizontal Direction
• Tile in Vertical Direction
• Do Not Tile
You can define the position as one of the following:
• Top Left
• Top Center
• Top Right
• Middle Left
• Middle Center
• Middle Right
• Bottom Left
• Bottom Center
• Bottom Right
On the Widgets tab, you can specify three properties: background (color and image); show/hide titles (size and font); and borders as Outside only, Outside and under the title or Under the title only, border color, border width, and border style as None, Dashed, Dotted, Double, Groove, Inset, Outset, Ridge orSolid. To enable the Titles and Borders option, you must select the check box for Show Title andBorders, when required. The changes you make on the Widgets tab affect all the widgets in the workspace.
When defining the widget background color, you can choose from two values available in the drop-down list (None and Set Color). Clicking Set Color... brings up the Set Color window where you can either choose from the Palette or provide Custom values as named color or hexadecimal value.
You can also define an image for the widget background. By default it shows a value of None; however, you can pick from the two options available to you in the drop-down list: No image and Set image...Clicking the Set image... option brings up the Set Image window. Provide the image URL address ashttp://www.server_name/image_path/image.gif. The URL must point to an administrator approved domain. The Tiling and Position options available here are identical as available for a page.
If you do not like what you see in the preview window, you can choose Reset to Default. This option is available on both the Tabs and Global Area and Widgets tab of Edit Workspace Style... window.
To edit Workspace Style...., perform the following steps:
1. On the Application bar, click the Layout and Style, from the drop down list choose Edit Workspace Style....
2. On the Tabs and Global Area tab, click the drop-down list for Color, and choose Set Color....
3. Navigate to the Palette tab, and choose lavender (or a color of your choice).
4. Click OK.
5. Click the Image drop-down list, and choose Set image....
6. Provide the URL for the image. (Ask your administrator for the correct URL.)
7. Choose Tiling and Position options as required or proceed with the default.
8. Click OK.
9. Navigate to the Widgets tab.
10. Click the Color drop-down list, and choose Set Color....
11. Navigate to the Custom tab, and type abc124.
12. Click OK.
13. Check the Show Titles check box.
14. Proceed with the default Font and Size (or change to the one of your choice).
15. Check the Borders check box.
16. From the drop-down list, choose Under the title only (or one of your choice).
17. Click Color, and choose Set Color....
18. From the Palette tab, click Plum.
19. Click OK.
20. Click Style; from the drop-down list choose Double.
21. Change the width to 2 (or one of your choice).
22. Click OK.
Insert
Use the Insert option to add workspace objects (for example, content or toolbox items) to your workspace. Review the two tabs available on the bottom of the Content pane: Content tab and Toolboxtab (refer to Figure 8.2).
When you click the Insert icon on the Application bar, the drop-down list provides you with two options: Insert Content and Insert Toolbox Widget. Clicking the Insert Content takes you to theContent tab on the Content pane. You can now drag and drop the content you need from the Content pane.
If you choose the Insert Toolbox Widget option from the Insert drop-down list, the control shifts to theToolbox tab on the Content pane. You can now drag and drop the tools you need from there onto your dashboard.
Home
Home enables you to return to your home page or set a frequently used workspace as your home page. This option appears as a drop-down list with two options: Go to Home Page and Set Workspace as Home.
Go to Home Page
Wherever you are in Cognos Workspace, clicking the Home icon on the Application bar brings you to the workspace that you set as your Home workspace.
Set Workspace as Home
In Cognos Workspace you can set a frequently used workspace as your home page. Wherever you are in Cognos Workspace, clicking the Home icon on the Application bar brings you to the workspace you have identified as your Home.
To set a workspace as Home, perform the following steps:
1. Open the workspace you want to set as your home page.
2. Click the Home icon on the Application bar, and choose Set Workspace as Home.
3. The currently open workspace is now set as your home page.
Help
This option provides additional help using Cognos Workspace. It appears as a drop-down list and has five options you can choose from, for example, Help, How-to Videos, IBM on the Web, Show the Getting Started page, and About.
Explore Additional Options on the Application Actions Menu
Application Actions Menu is the first option available to you on the Application bar, as shown inFigure 8.2. Options covered in this section are those that are not available to you on the Application bar. Some options are context-sensitive and appear grayed out if the object for which it is applicable is not currently selected. For example, the Rename This Tab option is available only if the currently selected object in the workspace is a tab object. In addition, the options available to you via the Launchoption can also vary depending upon the Components installed in your Cognos BI Environment. For the New tab, Rename This tab, Remove This tab, and Order tabs, refer to the “Content Pane” section discussed earlier.
Save As
You can save an existing workspace with another name/another location. When you click this option, you are requested to provide a name and select the location. You can click the Save button to complete the task.
Copy Link to Clipboard
Use the Copy link to clipboard option to copy the link (URL) of a workspace. You can then open another browser and paste the link to get to the workspace directly. Use this option to send the link to others with whom you want to share the workspace within your organization, or save it in other documents. Users must have permissions to view the workspace.
To copy a link to clipboard, perform the following steps:
1. Open a workspace, for example, Sales dashboard.
2. From the Actions Menu > Copy link to clipboard.
3. Open a new browser and paste the link in the browser.
4. The Sales dashboard opens up in your new browser.
My Preferences
The choices made using My Preferences is unique to each user, and selections made here do not impact other users. Use this option to personalize how the data appears in your workspace. Your setting takes effect immediately and will be stored for future sessions.
To set My Preferences, perform the following steps:
1. Click the Applications Actions Menu and choose My Preferences. This opens the Set Preferences window.
2. Select the check box for Enable accessibility support for reports, if you want to enable the accessibility features in Cognos Workspace for users with disabilities (for example, limited vision or restricted mobility). If you do not require these features, you can uncheck this option.
3. Select the check box for Show the Getting Started Page at startup, if you want see the Getting Started page every time you log in to Cognos Workspace. Otherwise you can uncheck this option.
4. Select the Product Language from the drop-down list. When you change the Product Language to say Spanish, some of the options available to you on the screen appear in Spanish. For example, if yourProduct Language is Spanish, the buttons Create New and Open Existing on the Getting Started pageappear in Spanish.
5. Select Content Language from the drop-down list. When you change the Content Language to Spanish, Public Folders and My Folders appear in Spanish rather than English.
NOTE: For the content of the dashboard to appear in Spanish, the database, Framework Manager package, and report must be configured for Spanish language.
6. Set your Time zone from the drop-down list. For example, (GMT-10:00) Hawaii Time:Honolulu, Tahiti, or that which is appropriate for you.
7. Click OK to apply your changes.
NOTE: The changes you make via My Preferences impact your user session, that is, in the Cognos portal, and are not restricted to Cognos Workspace.
Log Off
Use the Log off option from the Applications Actions Menu to log off from the IBM Cognos BI environment.
Launch
The Launch option enables you to launch another installed Cognos component from Cognos Workspace. You can select from Cognos Workspace Advanced, Query Studio, PowerPlay Studio, Analysis Studio, Report Studio, Event Studio, Drill Through Definitions, IBM Cognos Connection, and IBM Cognos Administration. As mentioned earlier, the options available might vary depending upon the logged on user’s permissions in the IBM Cognos BI environment.
Components such as PowerPlay Studio and Metric Studio appear in the list only if you have those components installed in your IBM Cognos BI environment.
WIDGETS AND WIDGET TYPES
Widgets are containers that hold the objects you add to your workspace. Depending on your needs, you can add one or more widgets to your workspace. Depending on the type of widget, the options available to you for manipulating the widget content will vary.
As discussed earlier, you can work with two types of widgets available to you: Content widgets and Toolbox widgets. Use content widgets to drag and drop from the Content pane reports or report objects, packages, and folders. Toolbox widgets on the other hand enable you to add objects such as filters, images, RSS feed, a web page, My Inbox, and Text to add titles on your workspace. Toolbox widgets have tools that you can use to enhance your workspace.
Every widget has an On Demand toolbar, which appears when the widget is in focus, that is, when you click anywhere in the widget. The On Demand toolbar provides options such as undo, redo, filter, sorting, calculations, group/ungroup, and change the display type to another display type (such as bar chart, column chart, pie chart, list, and crosstab) options to change the color palette (to Classic, Contemporary, Corporate), add comment for collaboration, Do More... (for modifying/enhancing the existing report or workspace), and maximize this widget.
Widgets can communicate with each other if they are so set up. It is common and desirable that widgets communicate with each other. For example, if you have a Slider filter or a Select Value filter widget in the workspace, you want the data in the report widget to change depending upon the values you select in the filter widget. If required, you can modify the setting so that the widgets do not listen to each other or the specified ones.
You can drag and drop widgets anywhere on your workspace canvas. To drag and drop the widget or move it around on your canvas, click the widget and move your cursor toward the toolbar at which point the icon changes and looks like a star (four direction arrows) indicating that now the widget will move as you move your cursor.
Content Widgets
You use content widgets in your workspace each time to drag and drop content from the Content paneinto your workspace. The sections that follow explain the different types of content widgets you can work with in Cognos Workspace.
Report Widget
The Report widget is used for reports or report parts created using Analysis Studio, Metric Studio, Query Studio, and Report Studio. Report widgets are also used for Report Views and saved report output versions, when you use them in your workspace. Reports with drill through, prompts, and navigation are also supported.
When you analyze data from a saved report, you can drag and drop report parts from a saved version of the report onto your workspace.
If you have Metric Studio installed, you see Metric Studio content in the Content tab that you can use to build your workspace. You can use individual metrics, Metric Types, Strategies, Scorecards, andWatch lists.
You should use report parts in your workspace rather than the entire report because not only does it keep the information focused in the workspace, but it also contributes to enhanced performance of the workspace. When added to the workspace, all Metric Studio content appears as a list of metrics for the selected item. The metrics appear with a hyperlink that opens the individual metric in Metric Studio. When you drag and drop an individual metric onto your workspace, historical data for the metric displays in a bar chart, by default. You see later that you can right-click the chart and choose another display type, for example, List table, and review the underlying data.
Widget toolbar options vary depending upon the object in the widget. Some of the toolbar options areUndo, Redo Change Display, Filter, Sort, Calculate, Group/Ungroup, Change Display Type, Change Color Palette, Comment, Do More.., and Maximize This Widget.
PowerPlay Widget
You can include PowerPlay widget in your workspace if you have PowerPlay Studio installed in your IBM Cognos BI environment. From the Content tab, you can navigate to the PowerPlay content, and drag and drop content into your workspace canvas. You can export your PowerPlay cube content to the CSV or XLS file via the Export option on the Widget Actions Menu. Options available to you in IBM Cognos PowerPlay are available to you in the Widget Toolbar, as documented in the following list in the same sequence, and shown in Figure 8.11:
1. Crosstab and Indented Crosstab (allows you to view the levels of nested categories as indented, enabling the relationships between categories to be displayed easily).
2. Chart the display type (Simple Bar, Pie, Clustered Bar, Stacked Bar, Multiline, 3D Bar, Simple Line, Scatter, Correlation and Chart Options) which enables you to specify general chart info, its scale, Statistical options, Palette options, change background options, and define Labels on the chart.
3. Display Options (Edit Title, Split View, and Reset).
4. Swap rows and columns.
5. Hide and Show categories.
6. Create calculations using rows or column data.
7. Rank categories.
8. Zero suppression with suboptions Zero suppression rows and columns, Zero suppression rows only, Zero suppression columns only, and Suppression Options, which allow you to choose one or more options from Zero values, Divide by Zero, Missing Values and Overflow values.
9. 80/20 Suppression.
10. Custom Exception Highlighting option enables you to quickly focus on rows or columns in the report. You can compare two or more rows or columns to highlight data in the report that might need further analysis.
11. Custom Subsets allow you to work with selected data values.
12. Drill Through option enables you to navigate to another report for further analysis.
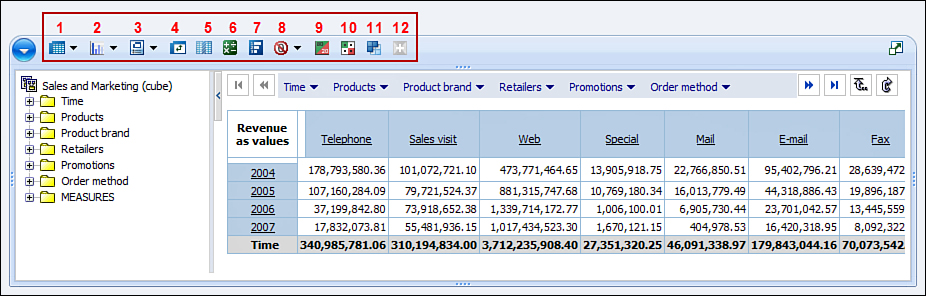
Figure 8.11. PowerPlay Widget options.
The Slider filter and Select Value filter widgets do not interact with the IBM Cognos PowerPlay report, and widget-to-widget communication is not supported.
TM1 Widget
If you have created objects using the IBM Cognos TM1 application, you can add TM1 objects to your workspace, as shown in Figure 8.12. For you to use TM1 objects, you must have TM1 installed and configured to use with IBM Cognos BI. You can add individual TM1 objects to the workspace, for example, TM1 Websheet, TM1 Cube View, and IBM TM1 Contributors; however, you cannot add entire folders. TM1 Cube View widgets listen to each other.
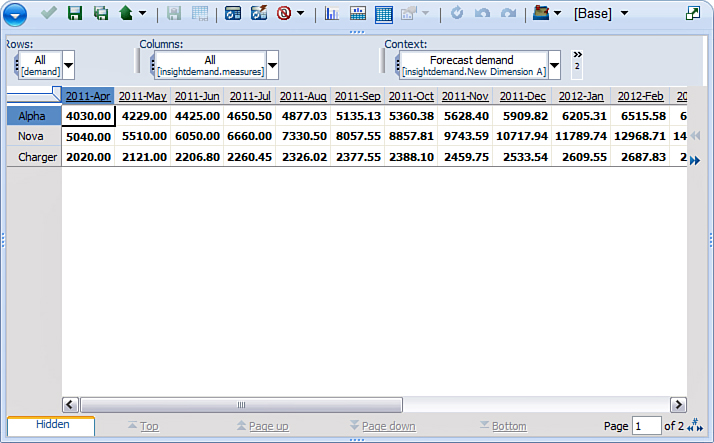
Figure 8.12. TM1 Widget options.
The TM1 Widget toolbar provides you with a number of options:
• Commit
• Save View
• Save As
• Export (Slice to Excel, Snapshot to Excel, and Export to PDF)
• Save Data Changes
• Review Data Changes
• Recalculate
• Automatic Recalculation Currently off (on/off toggle)
• Suppress Zeros (Suppress Zeros on Rows and Columns, Suppress Zeros on Rows, and Suppress Zeros on Columns)
• View Chart
• View Chart and Grid
• View Grid
• Chart Properties (Type, such as Point, Bubble, line, Color Palette, Toggle Chart Legend, Toggle 3D View, Chart Properties, such as, appearance, legend, labels, X-Axis, Y-Axis, and chart)
• Reset Data
• Undo
• Redo
• Sandbox (Create Sandbox..., and Delete Sandbox...)
• Base
The TM1 widget does not interact with Slider filter and Select Value filter.
IBM Cognos Navigator
When you drag and drop a folder from the Content pane on to the workspace canvas, the content of the folder displays in the IBM Cognos Navigator, as shown in Figure 8.13.
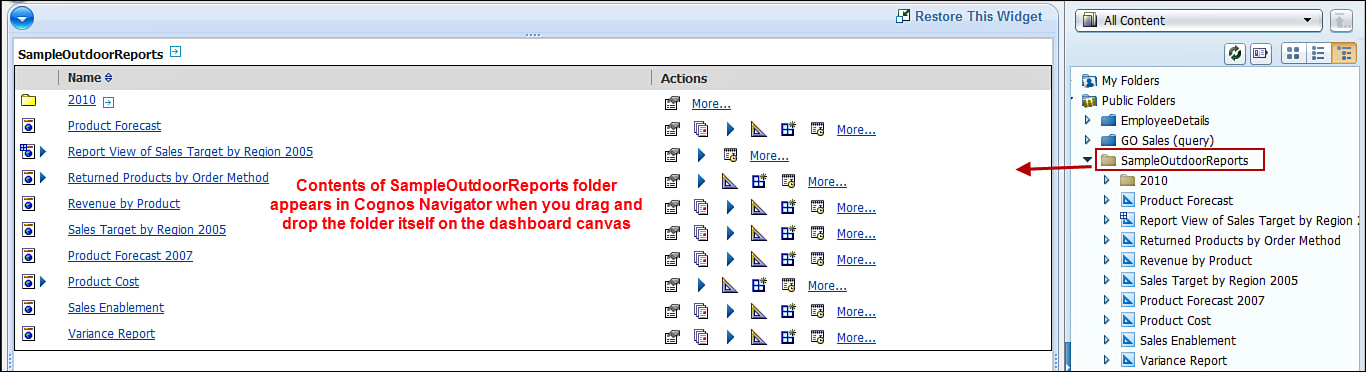
Figure 8.13. IBM Cognos Navigator Widget.
Active Report Content
You can add Active Report content to the workspace from the Content tab, provided that you have permissions to view and interact with Active Reports.
The key point to note when working with Active Report is that you can use Active Report content only if there is a saved output of the report. Ensure that a saved output of the Active Report has been saved for you to use it in the workspace.
The Active Report widgets listen to each other when the author has configured the Active Report to do so and you have more than one Active Report widget on the workspace. Active Report widgets communicate with each other, Report widgets, Slider filters, and Select Value filters; however, they cannot communicate with other Active Report widgets.
Toolbox Widgets
The Toolbox widget has tools that you can use to enhance your workspace. You can find them in theToolbox tab in the Content pane. The sections that follow describe the different Toolbox widgets in more detail.
Action Button
You can use Action buttons in the workspace to navigate from one tab to the other in the workspace. If wanted, you can add the Action button to the Global Area or the workspace, as shown in Figure 8.14. If required, you can also use an image for the button.

Figure 8.14. Use the Action button to navigate between tabs in a workspace.
Web Page Widget
Use the Web Page widget to add a web page to your workspace. The URL address must specify a web page, for example, http://www.ibm.com/smarterplanet.
NOTE: The web page URL must be added to the valid list of domains in your IBM Cognos Configuration tool by your IBM Cognos BI Administrator.
1. Navigate to the Toolbox tab in the Content pane.
2. From the Tools pane, drag and drop the Web Page widget onto your workspace.
3. In the Properties – Web Page window, type in your web page URL for example,http://www.ibm.com/smarterplanet.
4. Click OK.
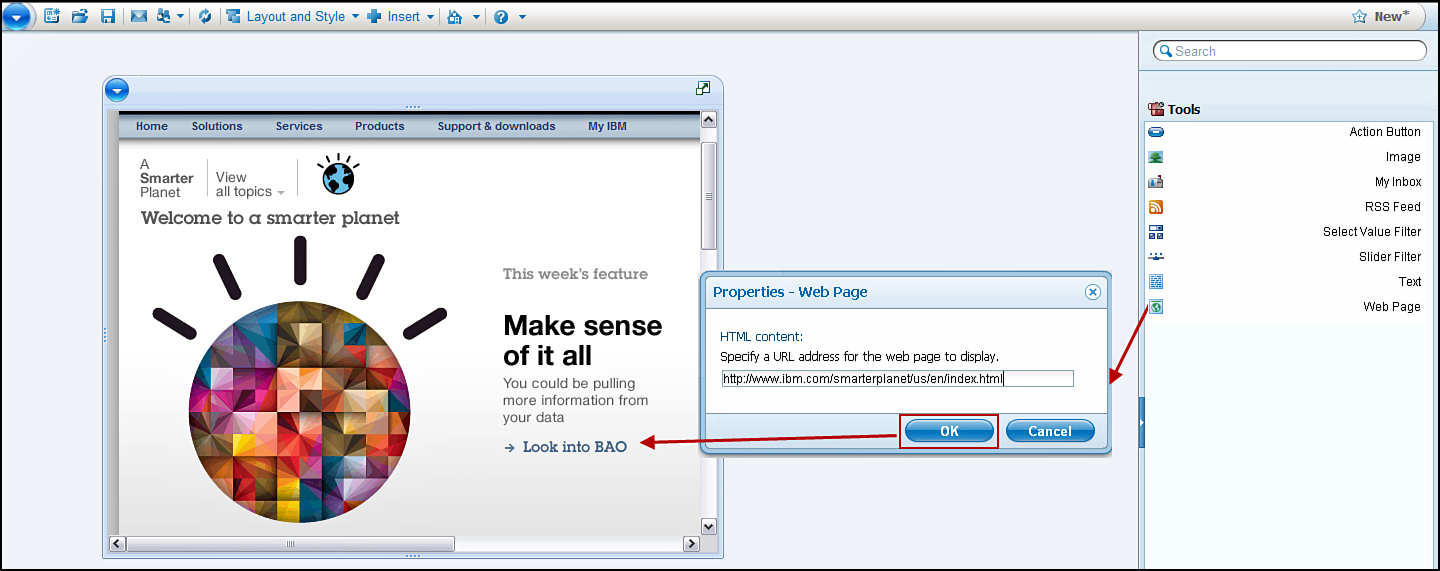
Figure 8.15. Web Page Widget options.
Image Widget
Use the Image widget to add images to your workspace, as shown in Figure 8.16. The image must be a single file in a location accessible by a URL, for example, ./samples/images/MtFuji.jpg. You can also use images as a link. You can specify the URL to be broadcast to all the widgets in your workspace, if required. The image must be a JPG, PNG, or GIF file.

Figure 8.16. Image Widget options.
To add an Image widget, perform the following steps:
1. Navigate to the Toolbox tab in the Content pane.
2. Drag and drop the Image widget on to your workspace.
Alternatively, you can right-click the Image option on Toolbox tab and select Insert.
NOTE: Cognos enables using a full address, as shown in step 3, or you can also specify a relative path within the Cognos web server location.
4. Provide image Height and Width in pixels.
5. Provide Alternate text (optional) to be used by screen readers.
6. Provide Target URL (optional) if clicking the image should take the user to a web page.
7. Open links to specify how the Target URL should display in the widgets, for example, Broadcast to all widgets (default) or In new window if you want the URL to open in a new window when the image is clicked.
8. Click OK.
NOTE: The image must be defined as a trusted domain list in the IBM Cognos Configuration tool.
My Inbox Widget
Use the My Inbox widget to display an RSS feed of your secured approval requests, ad-hoc tasks, and notification requests from My Inbox in IBM Cognos Connection, as shown in Figure 8.17. If no entries are found in your My Inbox, it displays No Entries.
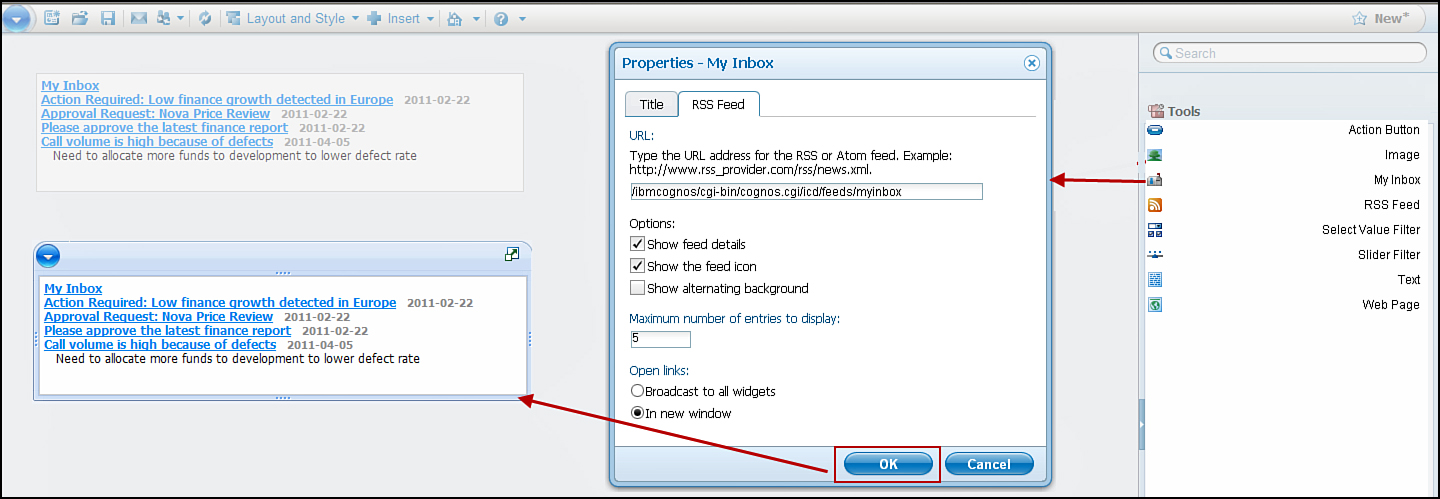
Figure 8.17. MyInbox Widget options.
To add the My Inbox widget, perform the following steps:
1. Navigate to the Toolbox tab in the Content pane.
2. Right-click My Inbox and choose Insert.
3. My Inbox content will be displayed as an RSS feed.
4. Click the Widget Actions menu and choose Properties.
5. From the Title tab, change the Widget Title from My Inbox to Updates from My Inbox.
6. Navigate to the RSS Feed tab and enable Show alternating background by selecting the check box, leave Show feeds details and Show the feed icon enabled.
Text Widget
Use the Text widget to add text to your workspace. You can use the text formatting options available here. To use this widget, drag and drop Text widget from the Toolbox tab in the Content pane onto your workspace canvas, and type in the required text, as shown in Figure 8.18.

Figure 8.18. Text Widget options.
RSS Feed Widget
Use the RSS Feed widget to display the Real Simple Syndication (RSS) feed or Atom news feed that is specified by the URL address, as shown in Figure 8.19. Ensure that the URL points to a valid RSS or Atom feed and not to a web page because the RSS Feed link you provide opens an XML file (not a web page).

Figure 8.19. RSS Feed Widget options.
To use the RSS Feed widget, perform the following steps:
1. Navigate to the Toolbox tab in the Content pane.
2. Right-click RSS Feed, and choose Insert to bring up the RSS Feed Properties window.
4. Check the option Show the feed icon and Show alternating background. Leave the optionShow feed details checked or as required by your implementation.
5. Specify the Maximum number of entries to display, for example, 5.
6. Specify the Open links option as Broadcast to all widgets or In new window (default).
7. Click OK.
NOTE: You must add the RSS or Atom feed URL to the trusted domain list in IBM Cognos Configuration tool.
Interactive Map Widget
Use the Interactive Map widget, as shown in Figure 8.20, to display location-aware data on the workspace. This option is not available by default and must be configured.
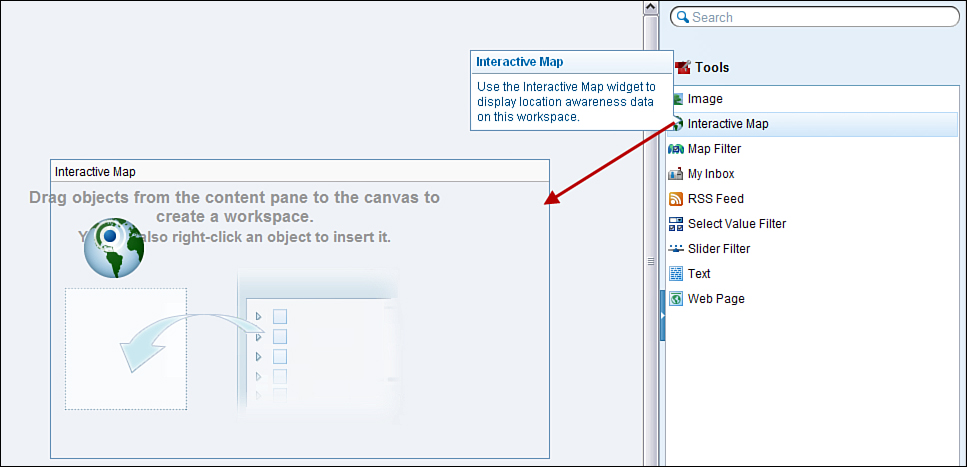
Figure 8.20. Interactive Map widget.
Map Filter Widget
Use the Map Filter widget, as shown in Figure 8.21, to display a location awareness filter on the workspace. This option is not available by default and must be configured.
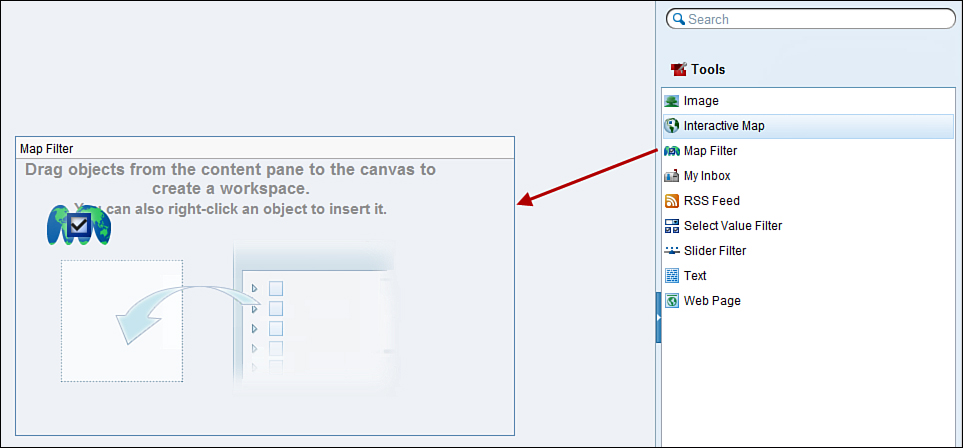
Figure 8.21. Map Filter widget.
Select Value Filter Widget
Use the Select Value Filter widget to allow users to focus the data in the workspace. When you drag and drop a Select Value Filter widget onto your workspace canvas from the Content pane, the data items currently in the workspace are available to you in the Select Value Filter Properties window, as shown in Figure 8.22. You can also specify if the users can select multiple values (via check boxes) or single value (via List, Menu, or Radio buttons). Optionally, you can provide a descriptive text. The Select Value Filter widget can be used for data items with descriptive text values.
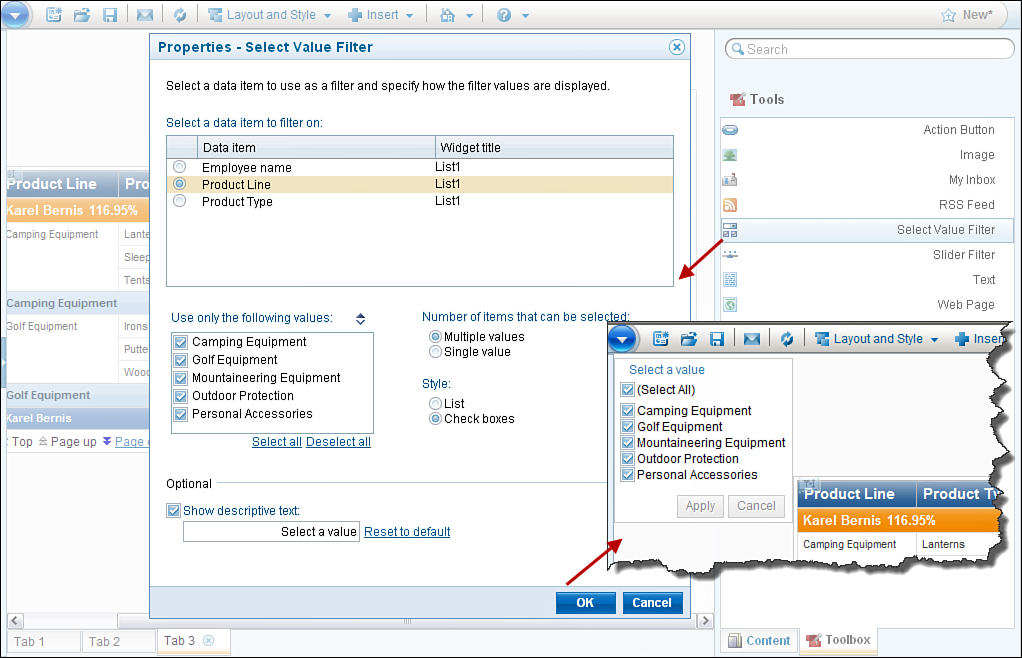
Figure 8.22. Select Value Filter options.
Slider Filter Widget
Use the Slider Filter widget to allow users to filter data from the report. When you drag and drop a slider filter onto your workspace, the data items on the workspace appear in the data item list with the name of the widget it belongs to, as shown in Figure 8.23. You can specify which data item you want to use for filtering via the radio button. You can also specify the data items that should show on the report via the Use Only the Following values. If you uncheck a value here, it will not appear in the workspace. You can also specify the Style as Range of values or Single value via the radio button. You can show/hide the values on the Slider filter via the check box Display values as filter labels. If you uncheck this box, only the lowest and highest values show on the slider bar.
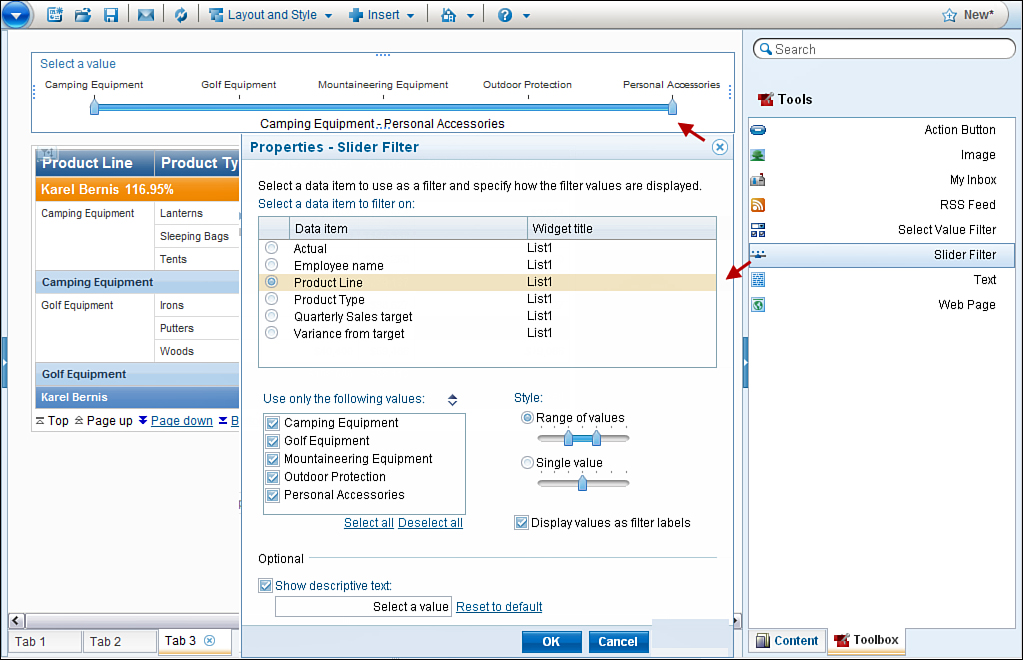
Figure 8.23. Slider Filter Widget options.
The Slider Filter can be used for data items with numeric or text values.
Explore the Widget Actions Menu Options
When you click anywhere in a widget, the On-Demand Widget toolbar appears. The options available to you on the toolbar will vary depending upon the widget type. Also, you will notice that some options on the On-Demand toolbar are grayed out, whereas some are available. This depends on the type of report object in the widget.
Some of the options available to you on a report widget are as follows:
• Remove from Workspace: Removes the widget from the workspace.
• Print as PDF: Prints the widget content to a PDF.
• Export to: Enables you to export the widget content to PDF, Excel 2007, Excel 2002, CSV, and XML. You can choose any one from the list.
• Versions: Displays the list of saved output versions for saved reports. To display the live version of the report, choose Live.
• Refresh: Refreshes the widget content in the workspace.
• Prompt Again: Shows in your Widget Actions menu only if the report is a prompt report. This option allows you to provide new prompt values for the report.
• Reset: If you have reset option available in the list, using this option can revert all your changes back to the base report, and all the changes will be lost. This option is only available for Live reports and is not applicable for saved output reports. When you click Reset, the Reset window appears seeking confirmation “Do you want to reset the widget to the most recent available version? Reset replaces the widget content and any changes are lost.” You can choose Yes to continue or No to keep the changes.
• Listen for Widget Events: Enable or disable widget-to-widget communication. Widgets on the workspace communicate to each other by default. You see in the next example that when you drag and drop a Slider filter, the report widget and the Slider filter communicate with each other by default without you having to configure any additional properties.
When the widget broadcasts information to other widget, it is the source widget. When the widget is listening to other widgets, it is the target widget. A widget can behave as the source widget and target widget at the same time.
• Resize to Fit Content: Resizes the widget to display all its content without extra whitespace or scrollbars.
• Send to Back: Sends the selected widget behind the other widgets when one or more widgets overlap.
• Do More....: Enables you to open the report in Cognos Workspace Advanced for enhancement.
• Properties: You can set the widget properties from here. There are two tabs available to you: theTitle tab and the Report tab. Use the Title tab to change the widget title. You can uncheck the box forShow Title on This Widget to hide the title. You can also modify the widget title settings by clicking the Edit Workspace Style... link from here. The Report tab enables you to define the Maximum number of rows to show per page. Use the check box to enable/disable Prompt when workspace is opened (prompted reports only) and the check box to enable/disable retrieve entire report (saved output only). You can also click the link View report specification to see the report specification. This tab also provides you the location of the report in the Content pane, for example, Public Folders > Samples > Models > GO Data Warehouse (analysis) > Report Studio Samples > Returns by Order Method. Options available are context-sensitive and vary depending upon the currently selected object.
Widget Toolbar Options
When you select a widget and bring it to focus by clicking it, a toolbar appears in the widget. This toolbar disappears if it is not currently selected.
Many functions are available to you from the On-Demand Widget toolbar. The options available to you in the toolbar vary depending on the widget type. In addition, the options enabled in the toolbar depend on current context, that is, where the cursor is focused in the widget. Some of the common features on the On-Demand widget toolbar are Undo/redo, Filter, Sort, Calculate, Group/Ungroup,Change Display Type, Change Palette, Comment, Do More..., Maximize, as shown in Figure 8.24.

Figure 8.24. Options available via a right-click.
Some of these options are also available to you via the right-click menu (refer to Figure 8.24). When you right-click a data item, you can see several interactive functions, for example, Drill Up/Drill Down, Go To Related Links, Move left/Right, and so on.
When you want to focus on only one widget, you can use the Maximize option on the On-Demand toolbar. To edit and further enhance the workspace, you can use the Do More... functionality and open the workspace in Cognos Workspace Advanced, assuming users are authorized to do so.
BRINGING IT ALL TOGETHER—BUILD YOUR OWN WORKSPACE
You can now use all the concepts covered so far to create a workspace and add filters, sort, comments, and calculations. As you go along, notice that the options available to you on the widget toolbar are context-sensitive.
1. In Cognos Connection, click Launch > Cognos Workspace.
2. On the Getting Started Page, click the Create New button.
3. Navigate to Public Folders > Samples > Models > GO Data Warehouse (analysis) > Report Studio Report Samples > Returns by Order Method > Crosstab1.
4. Drag and drop the report part Crosstab1 from the Returns by Order Method report, onto your workspace, as shown in Figure 8.25.
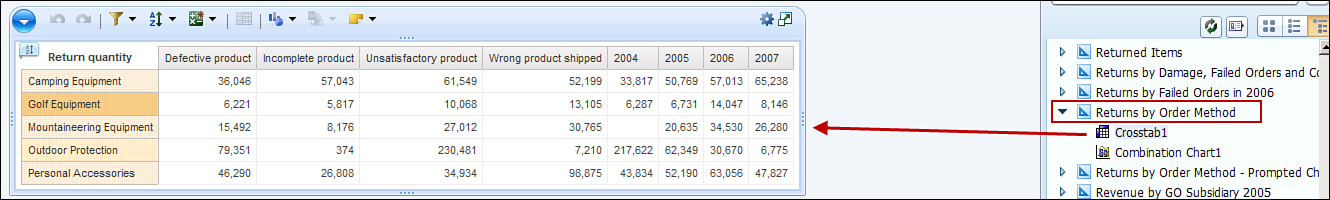
Figure 8.25. Create a report using existing Cognos content.
NOTE: Report part will be visible after you click the report.
You should identify the report part that you need from the report, for example, chart, list, or crosstab, and drop it onto the canvas rather than the complete report for efficient use of workspace space, report clarity, and performance. More often than not, you may need only a report part rather than the complete report. However, what you should drop on the workspace will be guided by your requirement.
You can swap rows and columns in the report using the swap rows and columns icon in the widget toolbar. This enables you to analyze the same information in a crosstab or chart from a different perspective.
Working with the Tabs
Tabs enable you to organize the data in the workspace. By default Tab 1 already exists in the workspace. You cannot delete the tab if it is the only one in the workspace. You can rename the tab from Tab 1 to another name that is meaningful to your business, as shown in Figure 8.26. Double-clickTab1 > in the Rename window, type a new name (Returns by Order Method) > click OK.
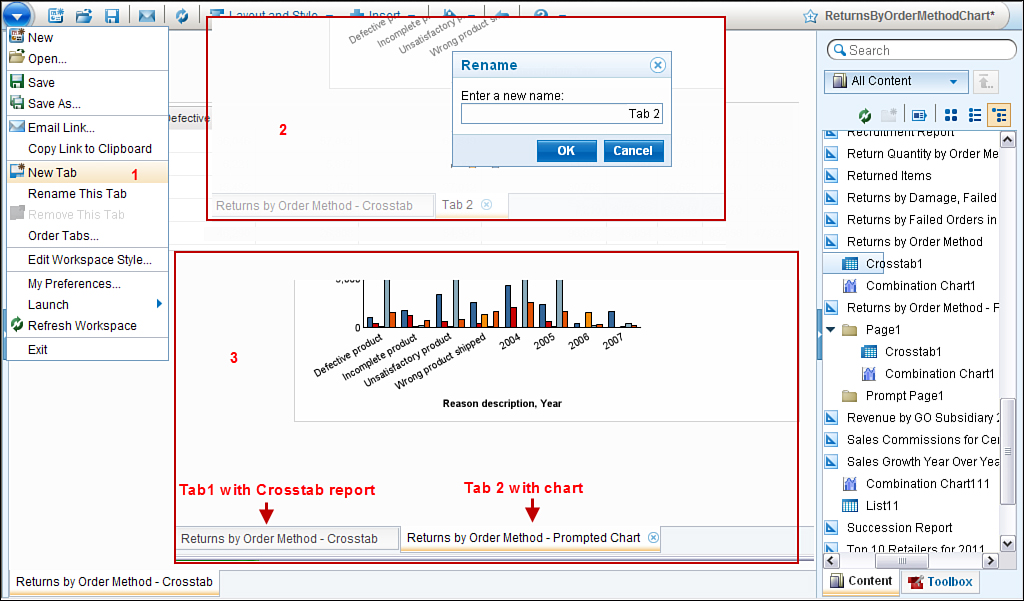
Figure 8.26. Organize data in the workspace by adding tabs.
The sections that follow cover some additional tab-related tasks.
Adding Two Tabs to the Workspace
Adding multiple tabs to the workspace enables you to display relevant data together without cluttering the workspace. You can now add another tab to the workspace and display a chart using the Returns by Order method data:
1. In Cognos Workspace, navigate to the Content tab, locate the Returns by Order Method – Prompted Chart Report in Public Folders > Samples > Models > GO Data Warehouse (analysis) > Report Studio Report Samples > Returns by Order Method – Prompted Chart > Page 1 > drag and drop Combination Chart1 to the workspace.
2. In the Order method type prompt window, select E-mail from the drop-down list > click Finish.
3. Click anywhere in the widget on the Widget Toolbar > click the drop-down next to the Change Display Type icon > click More... > in the Change Display window, there are two tabs:Recommended (lists recommended chart types) and All (shows all Chart types) > from theRecommended tab > select Line Chart > notice that in the Recommended Because section an explanation of why this chart type is being recommended is displayed > click OK. The workspace displays the data as a Line Chart now.
4. In the Widget Toolbar, click Undo.
5. Double-click Tab2 > in the Rename window > type a new name Returns by Order Method – Prompted Chart > click OK.
6. Save the workspace as SampleOutdoor Returns by Order Method - Prompted.
Adding a Filter in the Global Area
You now add a filter in the Global Area, as shown in Figure 8.27, and described in the list that follows. Adding a filter in the Global Area enables you to filter data in all the tabs and control it using one filter.

Figure 8.27. Using Global Area filters.
1. Expand the Global Area bar by clicking the arrow on the bar.
2. Navigate to the Toolbox tab.
3. Drag and drop a Select Value Filter to the Global Area.
4. In the Properties window for Select Value Filter > select the Year radio button > click OK.
NOTE: The Select Value Filter appears in the Global Area with all the years selected by default with check box options. This is so because you have used the default values for this example however you can change your selection by right-clicking on the Select Value Filter widget > Properties option. You can change the title or properties from here.
5. In the Global Area, select Value Filter > uncheck 2004 > click Apply.
NOTE: The data for year 2004 is no longer displayed in the workspace. Navigate to the next tab; the data for year 2004 is no longer displayed in this tab, either. When you apply a filter from the Global Area, the filter works on all the tabs. If your sample data does not have 2004, you can use another year to complete this task.
6. In the Global Area, select Value Filter > check 2004 > click Apply.
NOTE: The 2004 year data is now back on both the tabs.
Adding an Action Button in the Global Area
You can add an Action button from the Toolbox tab to the Global area to specify tab navigation or quick access to a tab by clicking a button, for example, Go to Tab 5, which takes you to Tab 5 from whichever tab the control may be at that time. Figure 8.28 illustrates this process, which is described in the list that follows.
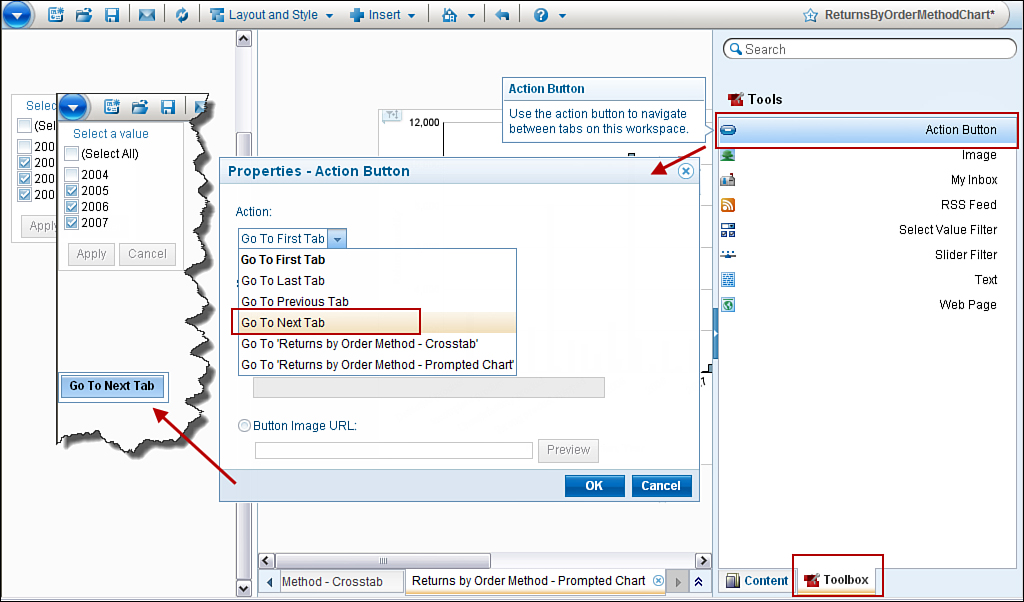
Figure 8.28. Adding an Action button in the Global area.
1. Navigate to the Toolbox tab.
2. Drag and drop an Action Button to the Global Area.
3. In the Properties window for Action Button, in the Actions section > select Go To Next Taboption from the drop-down list.
NOTE: The other options available to you by default are Go To First Tab, Go To Last Tab, Go To Previous Tab, Go To Next Tab, and options to go to specific tabs in the workspace, for example, Go To Returns by Order Method – Crosstab and Go To Returns by Order Method – Prompted Chart.
4. Click OK.
5. Click the Go To Next Tab button in the Global Area; notice the information now displayed is from the next tab.
6. Click the Go To Next Tab button again; notice the information displayed now is from the next tab, where the control was previously.
Freezing/Unfreezing Row and Column Headings
You can Freeze or Unfreeze row and column headings when working with List or Crosstab reports with large amounts of data. By default when you scroll through a large list of data, you lose the row/column heading. To keep the row/column headings visible when you scroll through the data in a List or Crosstab, you can use the options Freeze Row Headings and Freeze Column Headings by right-clicking the workspace. If you have already used the freeze option to freeze the row heading, you have the Unfreeze Row Heading option available when you right-click the workspace. You cannot control headings that have prompt controls. Figure 8.29 illustrates this process, which is described in the list that follows.
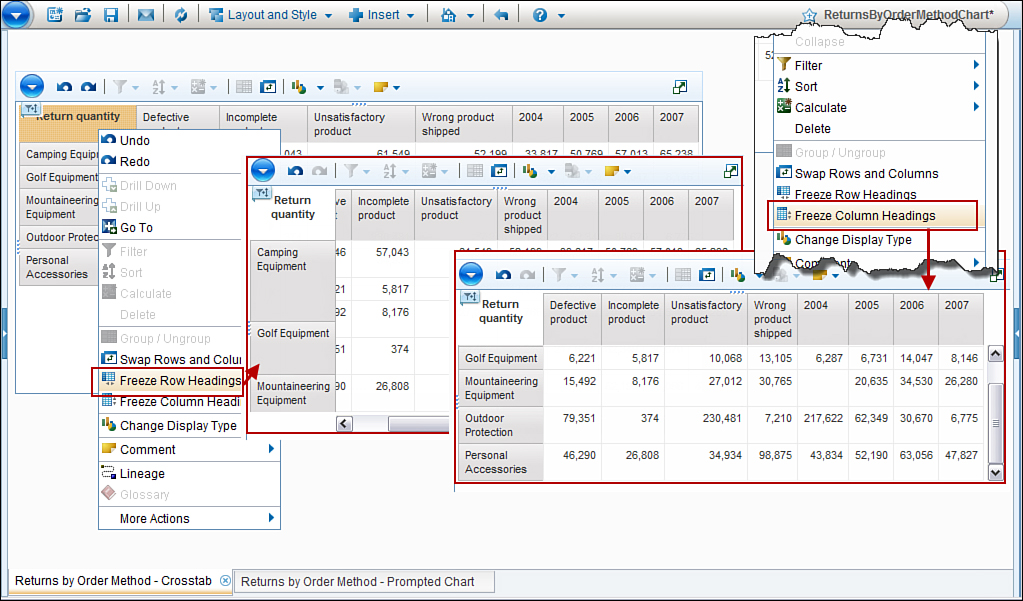
Figure 8.29. Freeze and Unfreeze Row and Column Headings.
1. Right-click anywhere in the currently opened workspace.
2. Select Freeze Row Headings.
3. Now scroll to the right; the row heading with Product lines, for example, Camping Equipment andGolf Equipment, is always visible and the data scrolls.
4. Next, right-click again; select Freeze Column Headings.
5. Now scroll down. Even though the data is scrolled the column headings always remain visible.
Expanding/Collapsing Column/Row Headings
When working with dimensional data, you can expand or collapse the column or row headings of the Crosstab to display lower levels of detail. For example, expanding the Product line in the Crosstab displays Product types for that Product line. You can choose a collapse option to display the next higher level of information. Figure 8.30 illustrates this process, which is described in the list that follows.

Figure 8.30. Expand and collapse column headings.
1. In the currently opened workspace, right-click Camping Equipment > select Expand.
NOTE: The workspace now displays the expanded view, that is, associated Product types in the Product lines.
2. Right-click Product line > select Collapse.
NOTE: The workspace now displays the Product lines and the associated Product types are no longer displayed.
Implementing Drill Down/Drill Up in a Report
To drill down or up in a report, perform the following steps.
1. Point your mouse on Camping Equipment, as shown in Figure 8.31. A hand icon appears andCamping Equipment appears as a link, which indicates that you can drill down to get more information on it. Click Camping Equipment. Examine the report; the information on the report changes to show all Product types that belong to Product Line - Camping Equipment.
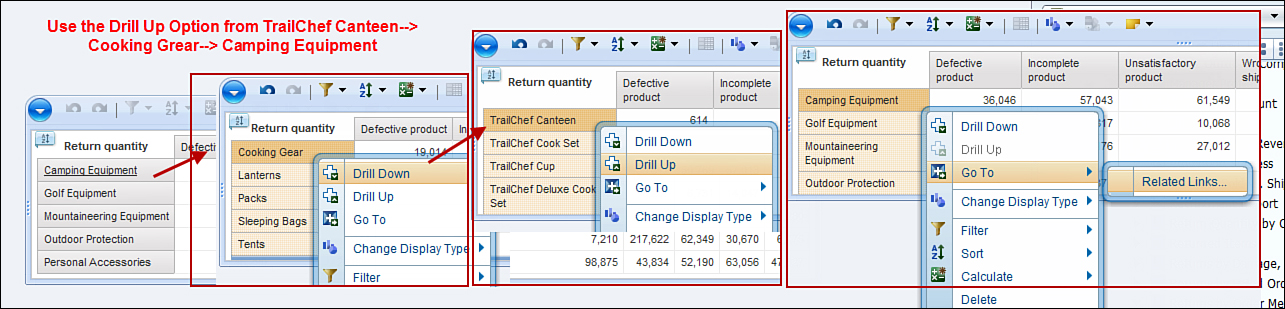
Figure 8.31. Drill-down and drill-up functionality.
NOTE: Drill down/drill up capability will be available to you only when the metadata has been modeled dimensionally.
2. Right-click Cooking Gear, and from the available options, select Drill Down. Examine that the report now displays all the products in the product type Cooking Gear, for example, TrailChef Canteen.
3. Right-click TrailChef Canteen, and choose Drill Up. Examine the report. It now displays a higher level of information in the report, for example, it’s back to Cooking Gear (not shown in the figure).
4. Right-click Cooking Gear; choose Drill Up. Examine the report. It now displays a higher level of information, for example, it’s back to Camping Equipment.
5. Right-click Camping Equipment, choose Go To > Related Links.... There is no drill-through report defined, but if there were any related target reports, they will show up in a list that you can click to see detail data. The target report can be a Query Studio report, Report Studio report, Analysis Studio analysis, Cognos Series 7 report, or Microsoft Analysis Services report.
6. Click Cancel to close the Go To page and return to your workspace.
Drill Up is grayed out or disabled (in the rightmost box in Figure 8.31) because you are at the topmost level and cannot go up to any higher level.
Adjusting Layout and Style...
To adjust the layout of widgets in your workspace, perform the following steps.
1. Click Layout and Style on the Application bar > choose Fit All Widgets to Window, notice the widget window (white space) increases.
2. Next, click Layout and Style > Arrange All Widgets to Fit Content > click Current Tab.
NOTE: There are now two options available to you, that is, Current Tab and Global Area. Select the tab that you want to arrange the widgets in. The Arrange All Widgets to Fit Content option is useful when you have multiple widgets in the workspace, and you want to cleanly fit them all.
Editing Workspace Style...
To adjust the style of your workspace, perform the following steps.
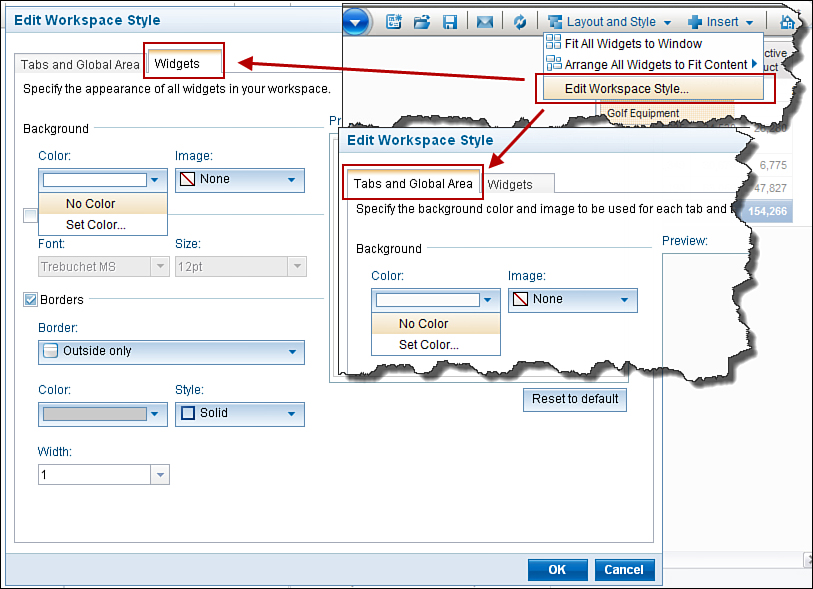
Figure 8.32. Edit Workspace Style options.
2. On the Tabs and Global Area tab > click Color > choose Set Color... > from the Palette, choose Lavender > (auto-submit used UI now).
3. Optionally, if you want to use an image for page background, click on the drop down for Image > Set Image... > type the image URL, for example,http://www.server_name/image_path/image_filename.gif > click OK.
4. Click the Widgets tab in Edit Workspace Style window > in the Background section clickColor > choose Set Color... > choose light yellow (or color of your choice).
5. Check the box for Show Titles.
6. In the Borders section, click the drop-down list for Border > select Under the title only.
7. From the Style drop-down list, change the Style > Double and Width to 2.
8. Click OK to close the Edit Workspace Style dialog.
9. Examine the name of the report part. Crosstab1 shows as the title of the workspace, and the background color of the widget has changed to light yellow, whereas the workspace background is still lavender.
10. Click anywhere in the report widget. This brings up the On-Demand widget toolbar. Click theWidget Actions menu (the blue button with drop-down on left of the toolbar). Examine the options available to you in the toolbar. These options will vary depending upon the widget type and object in the widget. Choose Properties, as shown in Figure 8.33.

Figure 8.33. Modify the Widget title via the Properties option.
Adding a Widget Title
To adjust the title of your widget, perform the following steps.
1. On the Title tab in the Properties window, change the Widget title from Crosstab1 to Returns by Order Method > click OK.
2. On the On-Demand widget toolbar, click Remove from Workspace. This brings up theRemove Widget window, with the question, Are you sure you want to remove this widget from the workspace? Clicking the Remove button would delete it from the workspace. In this example you do not want to remove it from the workspace. Click Cancel because you need this widget in the next section.
Sorting Data
To adjust the sorting of data using the widget toolbar, click the column header, for example, Wrong Product Shipped > click on the Sort option in the widget toolbar > Sort by Value > Descending.
Examine that the data in column Wrong Product Shipped in now displayed in descending order.
NOTE: Options on the On-Demand toolbar are context-sensitive, if the Sort option is disabled, ensure that you clicked the Column header/label and not in the cell, as shown in Figure 8.34.
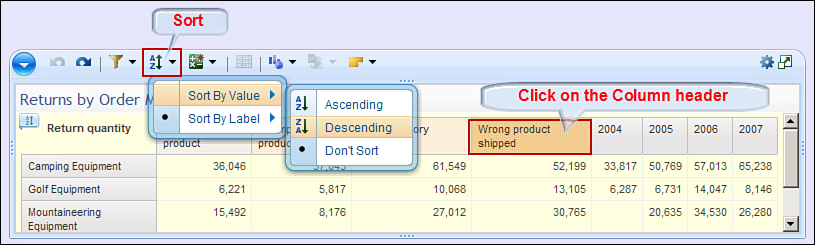
Figure 8.34. Dashboard with Sort options – prior to sorting.
Filtering Data
As you work through these steps, you can notice that the filter options available to you are context-sensitive. Options available to you may vary depending on where you clicked, for example, when you click the column header, if you click the data cell, or if you have multiple columns selected.
1. Click Column header Unsatisfactory Product > click the Filter option on the widget toolbar > choose Exclude Unsatisfactory product.
Examine that the report no longer displays the Unsatisfactory Product column in the report, as shown in Figure 8.35.
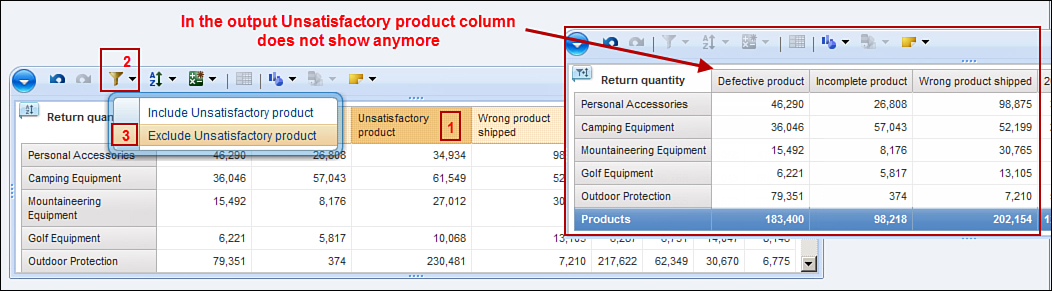
Figure 8.35. Filter data in the report using the Exclude option.
2. Click the cell 30,765 for Wrong product shipped (for Mountaineering Equipment) > click theFilter icon on the widget toolbar > choose > 30,765. This removes all the rows that have the value <= 30,765 from the report, as shown in Figure 8.36.
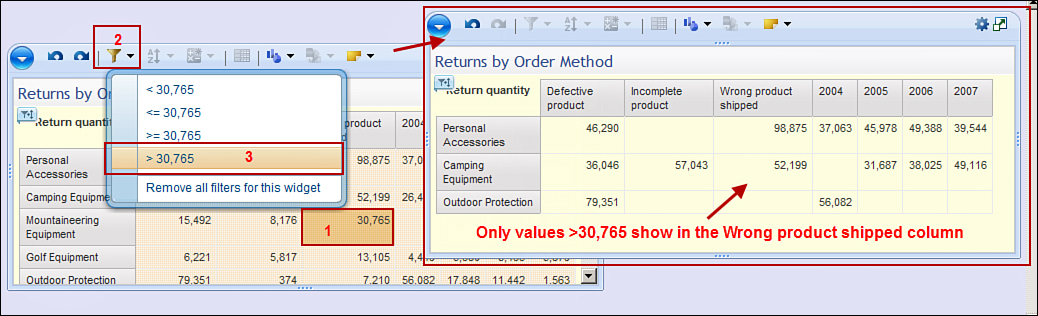
Figure 8.36. Filter data on a single column.
3. Click the Undo icon on the On-Demand toolbar, and undo the filter.
4. In the Wrong product shipped column, Ctrl+click in the cell value for Personal Accessoriesand Mountaineering Equipment.
5. Click the Filter icon on the On-Demand toolbar > select the option for Between, for example,Between 98,875 and 30,765, as shown in Figure 8.37.
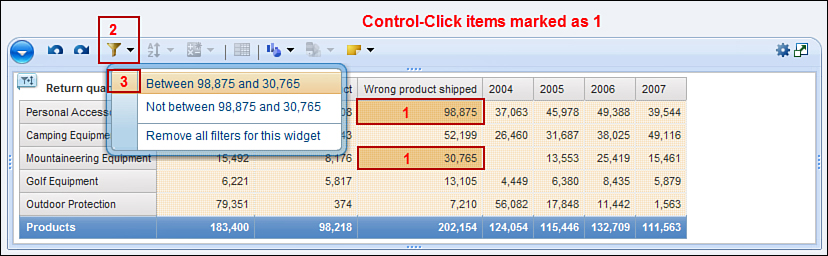
Figure 8.37. Range Filter options using multiple values.
Examine the other options available to you here; for example, Not between 98,875 and 30,675, andRemove all filters for this widget.
When working with filters, you must carefully choose between Slider filter, Select Value filter, andGlobal prompts that best satisfy your filter requirement.
Global prompts are pre-authored, which the user can drag into the workspace, just like any other content from the Content pane. If you are familiar with Report Studio, the global prompt uses a parameterized filter that is authored in the report. This is appropriate when you want the users to filter based on the latest data available in the data source, assuming the user has access to the data based on the data security defined.
To remove filters from dashboard widgets, click the Information Bar to display all the filters and sort conditions applied on the widget. Navigate to the filter Return quantity between 98,875 and 30,765. Click the Delete icon (x sign on the right), as shown in Figure 8.38.
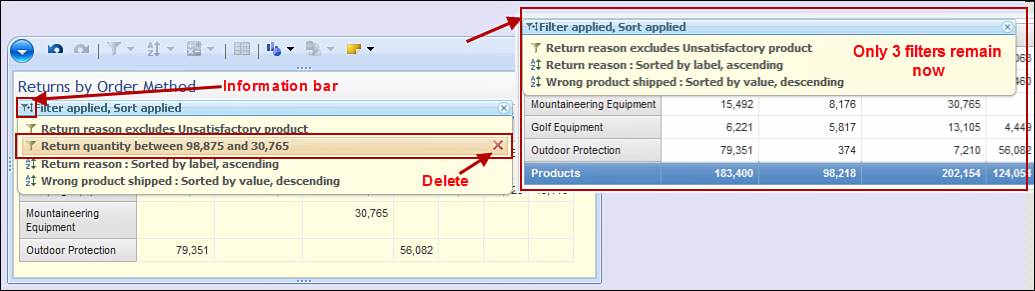
Figure 8.38. Use the Information bar to delete the existing filter on the widget.
Adding Comments/Annotations
You can add comments or annotations at the cell level or widget level. The process to add comments is similar in both cases. To add comments on a cell, you must first click the cell and select Comment Options from the Widget toolbar.
To add comments to a report part (for example, List, Crosstab, or Chart), you must first click an empty white space outside the report. Then from the More Toolbar Actions in the Widget toolbar, chooseComment > Add Comment – <<report part>> (for example, Comment > Add Comment – List1), as shown in Figure 8.39.

Figure 8.39. Add Comments on a report part.
When using this option, the purpose of this is to allow you to collaborate with other team members on the content of a report or workspace. Everyone who can view the report/workspace can see the comments. As you add comments to individual cells you must keep in mind that the comment belongs to the cell and not to the value. Over a period of time, the cell value may change; however, the comment is still available on the cell. You can either edit the comment or delete it as applicable during the workspace session. After the workspace session is closed, you cannot edit or delete comments from that session. You can only edit or delete the comments that you added, not those added by others. By default the comments on a cell display in reverse chronological order.
Comments are included in the output when you print a PDF version of the report or when you export a report to PDF or Excel output.
To add comments on a report part and cell, perform the following steps:
1. Click the Column header Defective product > click Add Comment – Defective product, as shown in Figure 8.40.
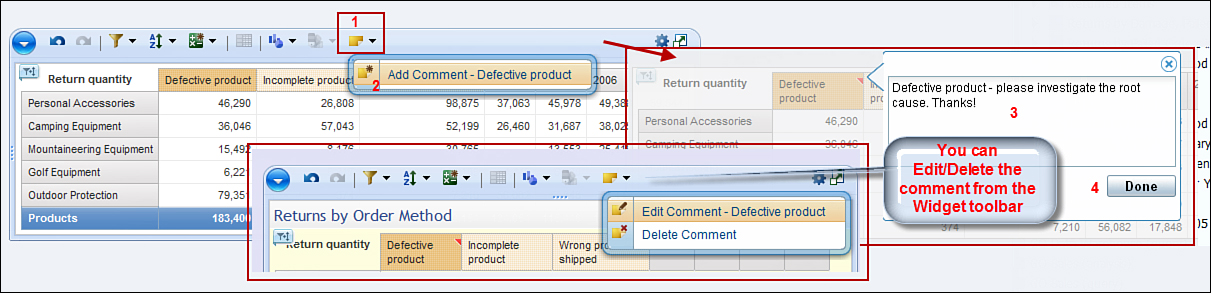
Figure 8.40. Edit Comments from the Widget Toolbar.
NOTE: You must first select the cell or report part you want to add comments on because comments are added on the currently selected object/cell.
2. You will be prompted, Do You Want to Save This Workspace? You Must Save the Workspace to Add Comments. Click Yes.
NOTE: If you have not saved the workspace yet, you will be prompted to save the workspace. Save the workspace now.
Changing Display Type
You can change the display type of the currently selected object using the Change Display Type option on the Widget toolbar. You will be presented a list of recommended display types that is best suited for the type of data currently in the workspace. However, if you want to use another display type, you can click the More... option. Additional details are covered in the section “Change Display Type and Visual Recommender.”
1. Click anywhere in the report widget and click the Change Display Type icon on the Widget toolbar> choose Column Chart from the recommended list, as shown in Figure 8.41.
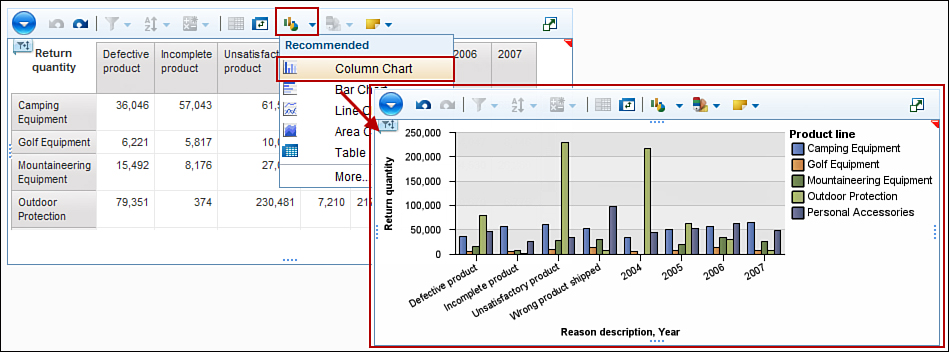
Figure 8.41. Change display type from Crosstab to Column Chart.
2. Now the Change Color Palette is enabled in the Widget toolbar. Click the Change Color Palette > choose Contemporary (or the one you require).
3. Change the display type back to Crosstab.
Adding Calculations
To add calculations in a report using the Widget toolbar, perform the following steps:
1. Click column header Incomplete product-number > click the Calculate icon on the Widget toolbar, as shown in Figure 8.42 (left box).
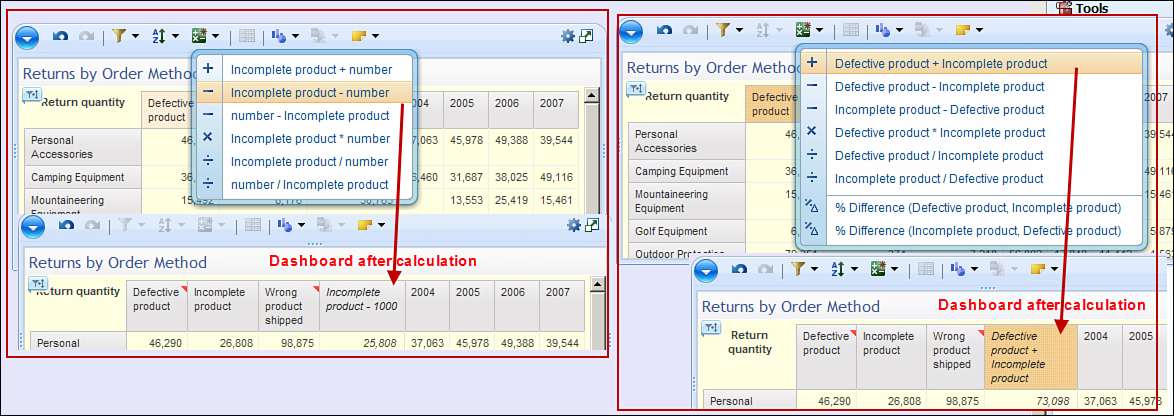
Figure 8.42. Perform calculations using single column (left) and multiple columns (right).
NOTE: You must click an empty space in the cell Incomplete product. If you click Incomplete Product you can drill down the report!
2. Choose the Incomplete Product – Number option from the list.
3. In the Enter the Number window, type 1000 and click OK.
4. This option enables you to create a calculation using a single value.
5. Click Undo on the Widget toolbar to undo the calculation.
6. Ctrl+click the column header Defective product and column header Incomplete product.
7. Ensure that the Calculate icon is now enabled on the Widget toolbar, as shown in Figure 8.42(right box).
8. Click the Calculate icon on the Widget toolbar.
9. Ensure the choices available to you now are calculations using the two columns you selected, for example, add the two selected column and subtract the two selected columns.
10. Click the first option, for example, Defective product + Incomplete product.
11. Ensure the new column was added in the report, for example, Defective product + Incomplete product. Optionally, you can right-click the new column > choose Rename and give it a meaningful name.
12. Click Undo on the widget toolbar because you need to find only the number and do not need this column in the final report.
13. Save the workspace.
Also, with dimensional data, you can perform calculations on nonmeasure items. The key point is the options available to you can vary based on the context and also the type of data source.
Grouping/Ungrouping Data
The Group feature is useful when there are repeating values for every row (for example, Reason description in the Returns by Order Method report). You can group data on one or more columns in a List report. When you group data on a column(s), the repeated values display only once for the grouped column(s). In addition, if the row has any numeric values, they are summarized at the level that grouping is performed—for the column(s) used for grouping. You can remove the grouping in the report by using Ungroup. You can see that the Group/Ungroup icon on the Widget toolbar works as a toggle. By default the Group/Ungroup icon is disabled on the Widget toolbar. You must first click anywhere in the report to enable it, as shown in Figure 8.43.
1. Click the report; then click the Change Display Type icon on the Widget toolbar> choose List Table.
NOTE: You can use the Bursted Sales Performance Report > List1 from Public Folders > Samples > GO Sales (query) > Interactive Samples > Bursted Sales Performance Report > List1. This report is already grouped on the Product line. You can ungroup it first and group again. Drag and drop the Product line column as the first column (if not already done) and group the data.
2. Click the column header Reason description > click the down arrow beside the column label, and examine the sort order change. From here you have Sort ascending, Sort descending, or Don’t sortoptions.
3. Click anywhere in the Reason Description column > click Group/Ungroup icon on the Widget toolbar.
4. Ensure the report Reason Description now repeats for every row in the report.
5. Click Undo to undo the Group/Ungroup change.
6. Click the Change Display Type > choose Crosstab to return the report to its original form.
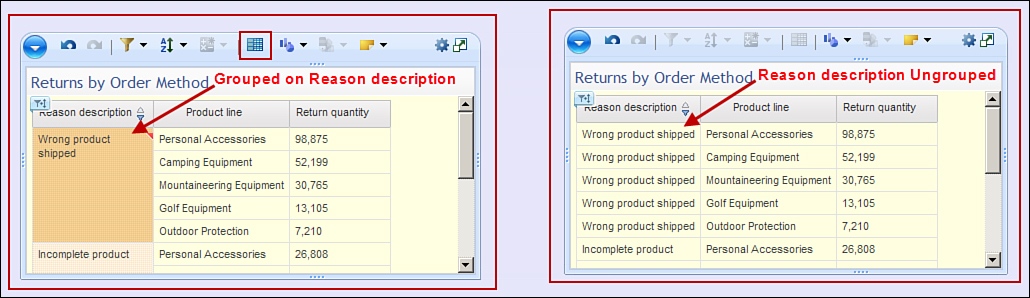
Figure 8.43. Group and Ungroup data in the report.
Adding a Select Value Filter Widget to the Workspace
Use the Select Value Filter to filter descriptive values in the workspace. You can use it to filter single or multiple text values. If the Select Value Filter is no longer required in the workspace, you can remove it from the workspace via the Actions menu > Remove from Dashboard option. Alternatively, you may want to remove only the filter that is applied via the Information bar on the report widget and clicking the X (delete) option.
1. Navigate to the Toolbox tab on the Content pane.
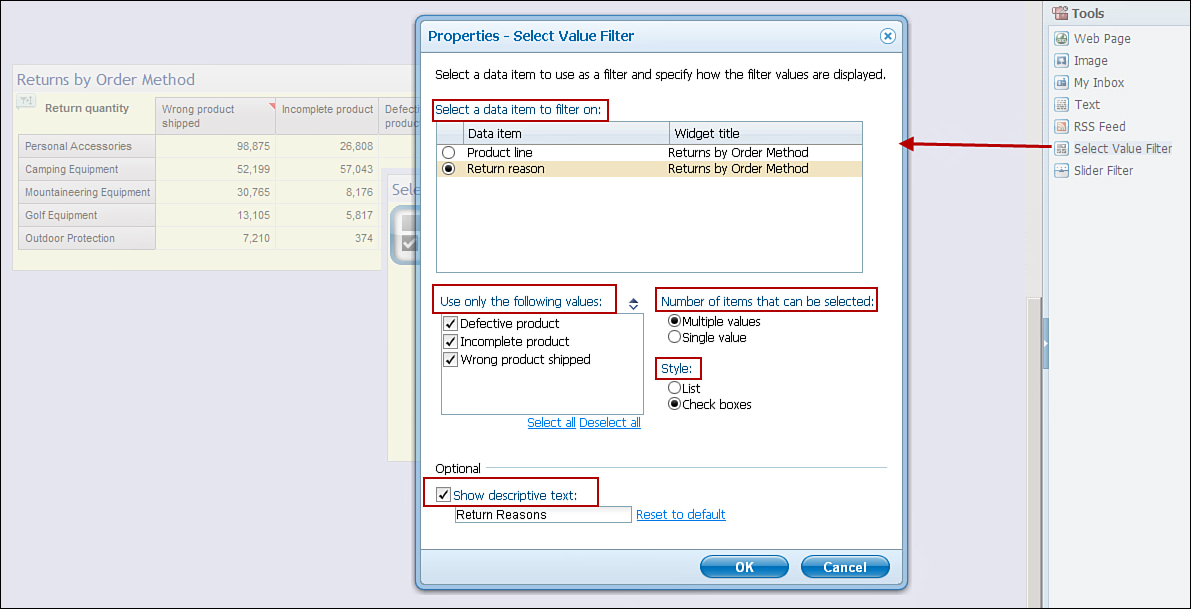
Figure 8.44. Create a Select Value Filter from the Toolbox tab.
3. In the Properties – Select Value Filter window> click the Return reason radio button for the data item to filter on option.
4. For the option Use only the following values, uncheck those you do not want. For this example you proceed with the default.
5. For the option Number of items that can be selected > keep the default of Multiple values. (In addition, the Single value option is also available.)
6. For the Style option, keep the default of checkboxes. (In addition, the List option is also available).
7. Change the descriptive text to Return Reasons.
8. Click the Select Value Filter widget > Widget Actions menu > Properties > uncheck Show title on this widget.
9. On the Select Value Filter widget, uncheck the Incomplete product option from the Return Reasons list > click Apply, as shown in Figure 8.45.
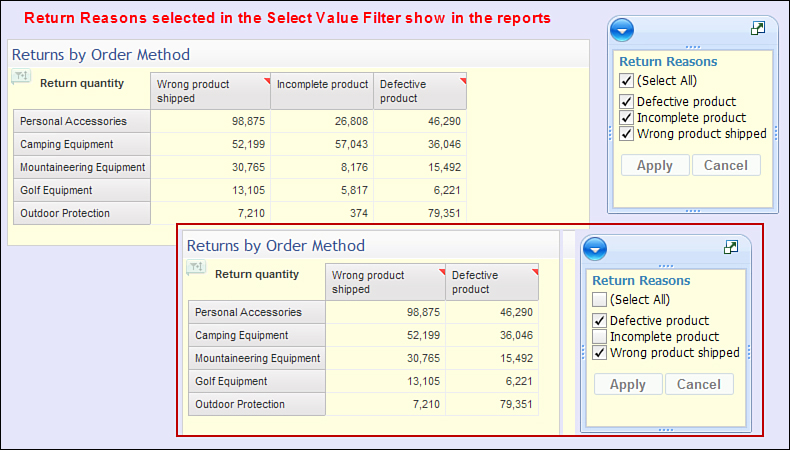
Figure 8.45. Select Value Filter selection and result.
Ensure that the report no longer has an Incomplete product column displayed.
10. Select the Select Value Filter widget > Widget Actions Menu > Remove from Dashboardto remove the Select Value filter from the workspace.
11. In the Remove Widget window > Remove, and confirm you want to remove it from the workspace.
Adding a Slider Filter to the Workspace
Slider filters are useful to filter both text and number values in the report. You can use this filter to display a single value or as a range. The following example guides you through how to use a Slider Filter.
1. Navigate to the Toolbox tab on the Content pane.
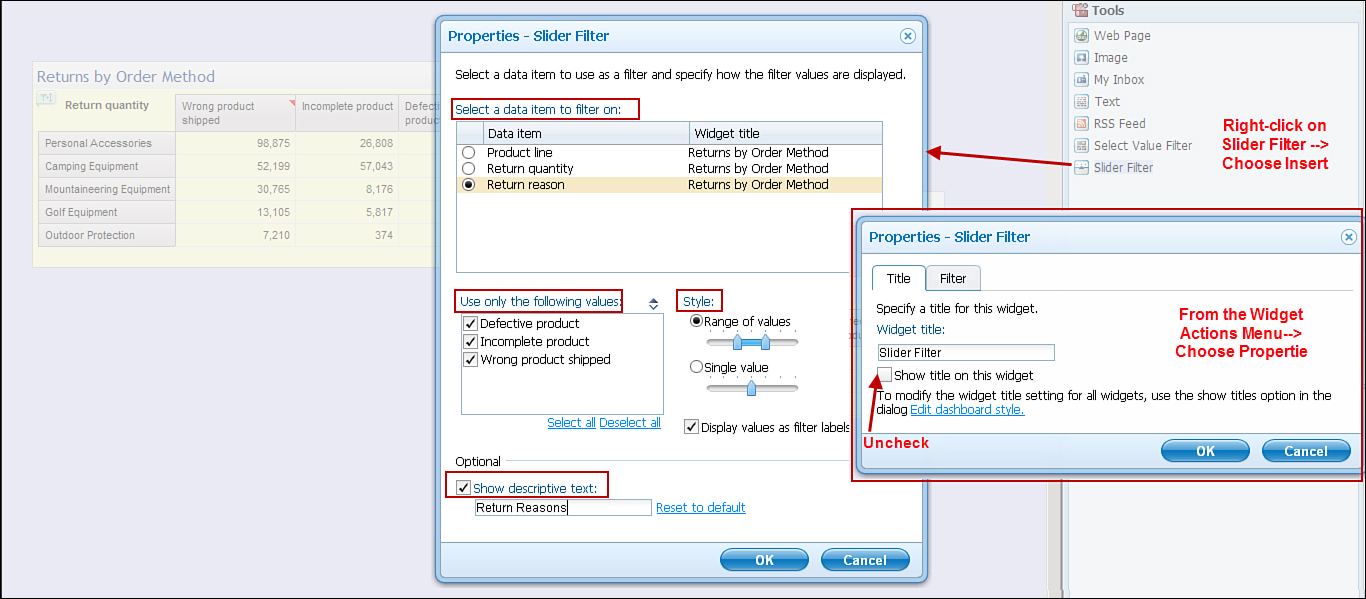
Figure 8.46. Set up the Slider Filter using the Toolbox tab.
3. In the Properties – Slider Filter window > for option Select data item to filter on chooseReturn reason (as shown in Figure 8.46).
4. For the Use only the following values option, proceed with the default. (All check boxes are checked.)
5. For the Style option, proceed with Range of values. (You can choose the radio button Single value, if required.)
6. For Show Descriptive Text option > type Return Reasons > click OK.
7. In the Slider Filter widget > Widget Actions Menu > Properties > Uncheck Show title on this widget> click OK.
8. Examine the Slider Filter and the range shown on it.
9. Slide the Slider Filter to the right so that it is aligned with Incomplete Product. The Slider bar should show Incomplete Product – Wrong Product Shipped. This means that you do not want to see the Defective products (because it is not in range anymore), as shown in Figure 8.47.
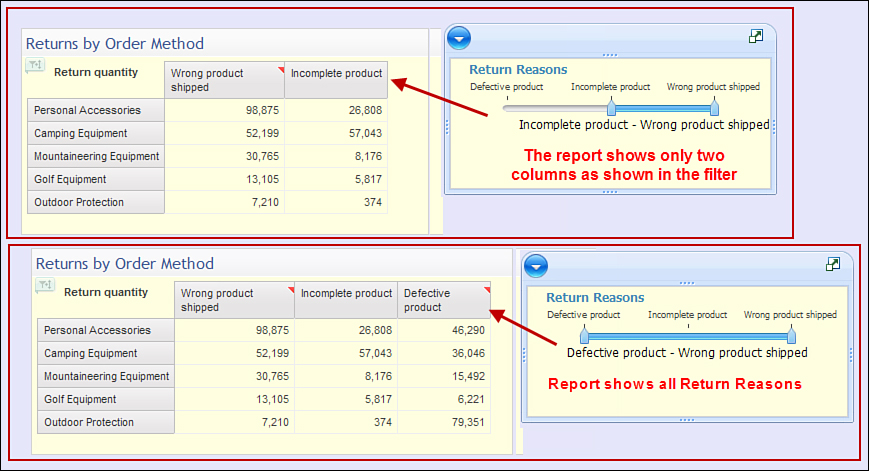
Figure 8.47. Slider Filter selection and result.
10. Click the Slider Filter widget > Properties > Filter tab > change Select a data item to filter on to Product line.
11. The Filter tab enables you to change the data item on which you want to filter the data in the workspace.
12. Change the descriptive text > type Product line.
Adding a Chart to the Workspace
Charts enable you to add another perspective to the data in the workspace. You can add a chart to the workspace by dragging and dropping a chart object from the Content pane. The following example uses a Report Studio report from the Cognos samples to display in the workspace.
1. Navigate to the Content tab in the Content pane.
2. Locate the Returns by Order Method report in Public Folders > Models > GO Data Warehouse (analysis) > Report Studio Report Samples > Returns by Order Method.
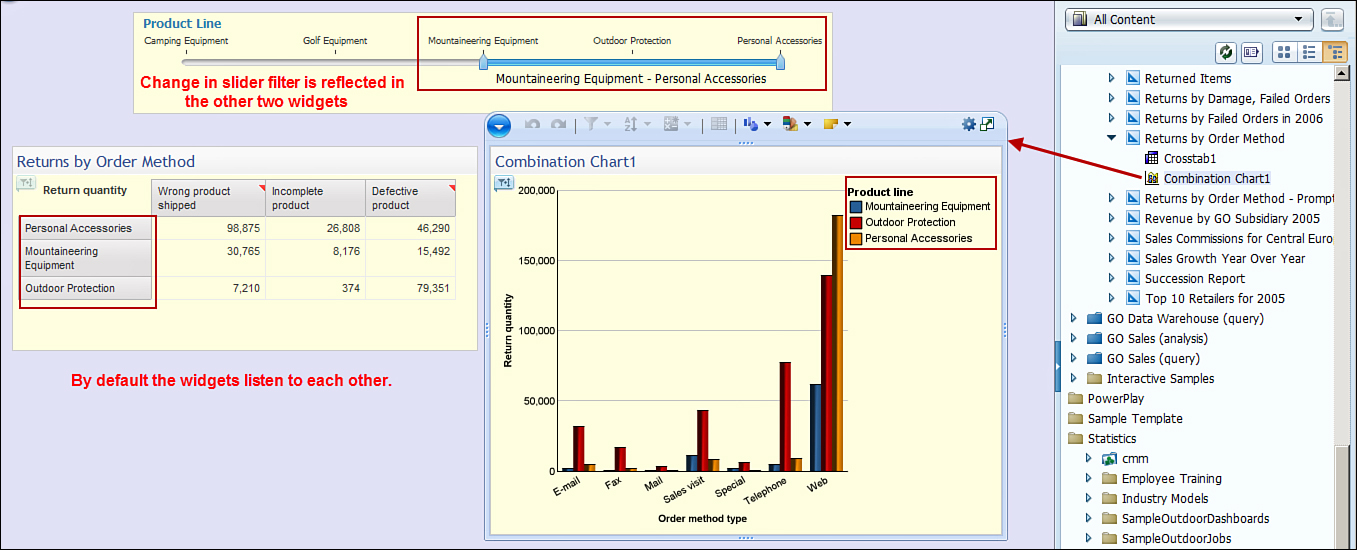
Figure 8.48. Add a chart to the report using existing Cognos content.
4. Click the Slider Filter > slide it to Mountaineering Equipment. (The slider bar should display Mountaineering Equipment – Personal Accessories.)
5. Examine the data changes in both Crosstab and Chart widget. By default, the widgets in the workspace listen to each other.
6. Save the workspace as SampleOutdoor Returns by Order Method.
You can resize a chart in the widget. When you resize the widget, the chart resizes to fit the widget. However, if you work with versions prior to Cognos v10.1.1, this may result in either scrollbars or white space in the widget.
Changing Display Type and Visual Recommender
You may also change the existing chart type to another chart type, for example, Pie to Column chart by using the Change Display Type option on the Widget toolbar, as shown in Figure 8.49. When you change the display type, you are provided with a list of recommended chart types. Not only does the Visual recommender recommend the chart type that is best suited to display the data in the widget, it also displays the reason why it recommends that option. The options are listed in the order of highly recommended first and so on. However, if you want to work with a chart type that does not appear in the recommended list, you can select another chart type from the All tab on the Change Displaywindow.
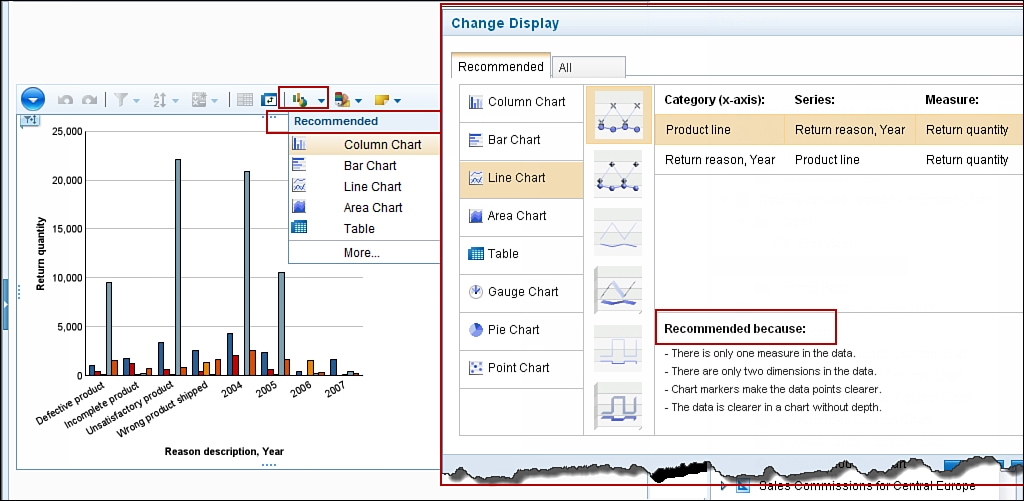
Figure 8.49. Changing the Chart Display Type.
To change the Chart Display Type, perform the following steps.
1. In Cognos Workspace, navigate to the Content tab > locate the Returns by Order Method – Prompted Chart report in Public Folders > Samples > Models > GO Data Warehouse (analysis) > Report Studio Report Samples > Returns by Order Method – Prompted Chart > Page 1 > drag and drop Combination Chart1 to the workspace.
2. In the Order method type prompt window, select E-Mail from the drop-down list > click Finish.
3. Click anywhere in the widget on the Widget Toolbar > click the drop-down next to the Change Display Type icon > click More... > in the Change Display window, notice there are two tabs, that is, Recommended (lists recommended chart types) and All (shows all Chart types) > from theRecommended tab > select Line Chart > notice the In the Recommended section is an explanation of why this chart type is recommended > click OK.
4. Notice the workspace displays the data as a Line Chart now.
5. On the widget Toolbar, click Undo.
6. Save the workspace as SampleOutdoor Returns by Order Method - Prompted.
Sorting Values in a Chart
You can sort the data in the chart by value or by label. As shown in Figure 8.50, sorting by value displays the data in the chart sorted by value ascending or descending, whereas sorting by label sorts ascending or descending by the label, as described in the following list. You can also choose the optionDon’t Sort to remove an existing sort condition.
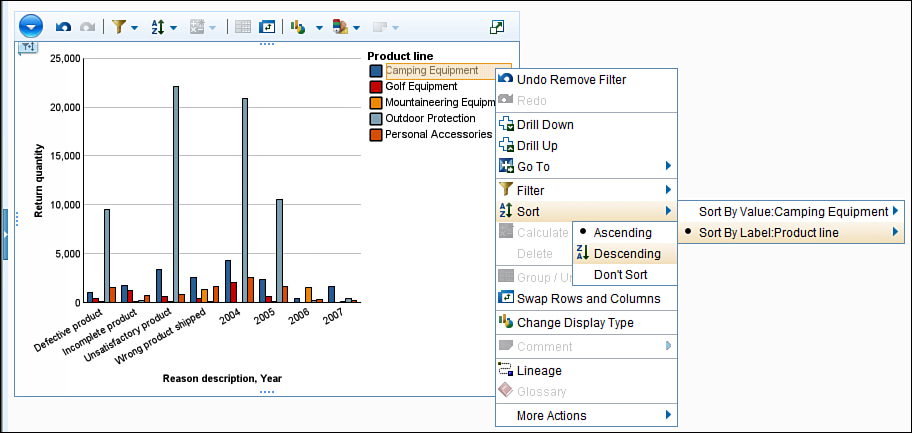
Figure 8.50. Steps to sort values in a chart.
1. Right-click Camping Equipment > select Sort > Sort by Label > Descending.
Notice that Camping Equipment moved to the bottom of the list.
2. Click Undo in the Widget Toolbar to undo the sort.
Filtering Data in a Chart
You can filter the data in the chart by selecting the value by which you want to filter the data. You can filter the data by excluding the data from the chart or bring the data back into the chart by selecting theInclude option, as shown in Figure 8.51. You can exclude multiple values by selecting them by Ctrl+clicking the items and then right-clicking to select Exclude.
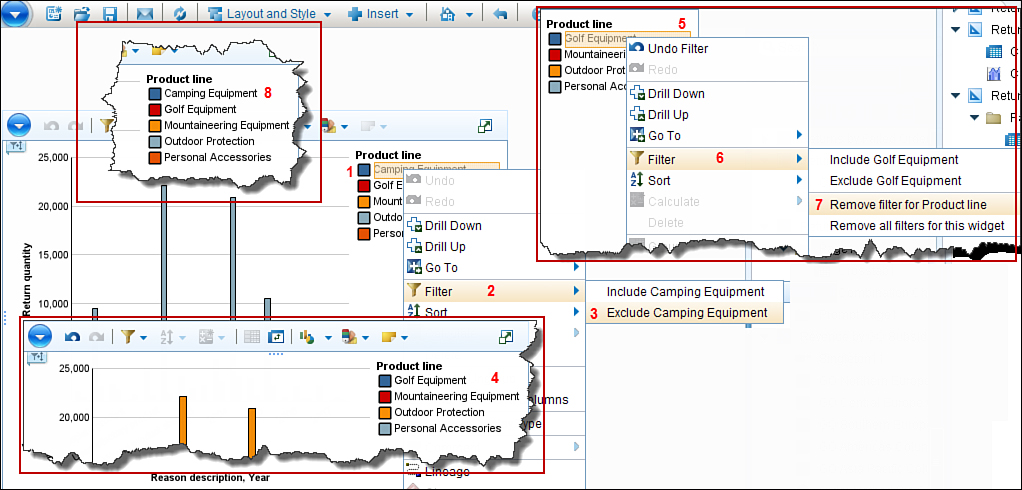
Figure 8.51. Excluding data from a chart.
To Include/Exclude data in the Chart, perform the following tasks:
1. Right-click Camping Equipment > select Filter > select Exclude Camping Equipment.
Notice under the Product line, Camping Equipment does not appear anymore.
2. Right-click any Product line value, for example, Golf Equipment > select Filter > selectRemove filter for Product line.
The Exclude Camping Equipment filter is removed, and Camping Equipment appears in the Product line list.
Drilling Up and Drilling Down in a Chart
If the chart uses dimensional data, you can drill up or drill down in the chart as shown in Figure 8.52. After you have drilled down to the lowest level of data, only the drill up option is available to you and vice versa.

Figure 8.52. Implementing drill up/drill down in a chart.
To drill up/drill down in a chart, perform the following steps:
1. Right-click Camping Equipment > select Drill Down.
The Product line label is now changed to Camping Equipment and the data in the list is all the Product types available for the Camping Equipment Product line.
2. Right-click Cooking Gear > select Drill Up.
Notice the data displayed is Product line again.
3. Save the workspace.
Controlling Widget-to-Widget Communications
As you noticed in the previous section, by default the widgets on the workspace listen to each other; however, you can change this behavior by performing the following the steps:
1. In Cognos Workspace, open as SampleOutdoor Returns by Order Method workspace.
2. Click the Chart widget > Widget Actions menu > Listen for Widget Events..., as shown inFigure 8.53.
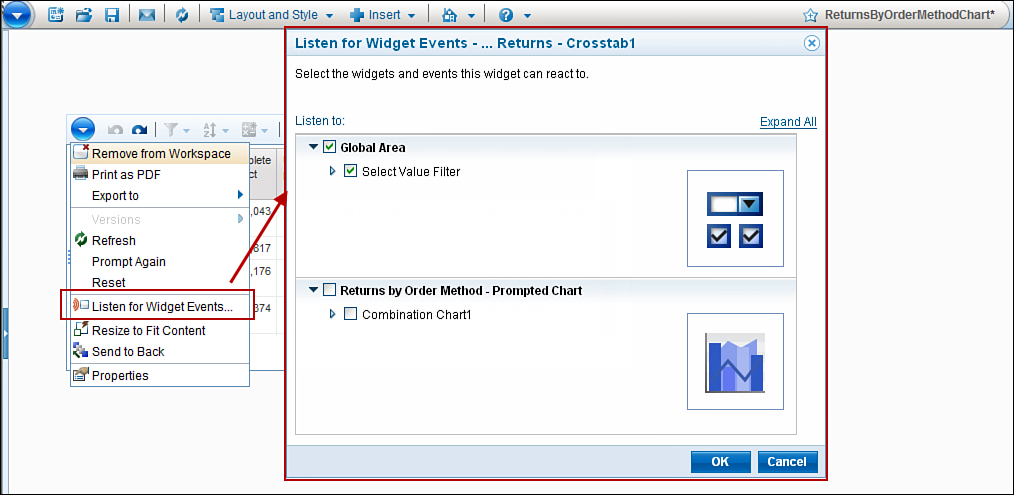
Figure 8.53. Configure widget-to-widget communications.
3. In the Listen for Widget Events – Combination Chart1 window > Uncheck Slider Filter > clickOK.
4. Slide the Slider Filter back to the starting point. The slider bar should display Camping Equipment – Personal Accessories. Notice that the data in the Chart does not change with the change in the slide filter; although the report data changes. This is because the Chart widget is no longer listening to the Slider filter widget.
5. Save the workspace.
DO MORE...
You can enhance your report or chart in the workspace by opening it in Cognos Workspace Advancedand modifying it. The Do More... button is available in the Widget toolbar.
Although you can do many more things to enhance your report, you can modify the chart properties only at this time. Additional options will be covered in the Chapter 9, “IBM Cognos Workspace Advanced.”
Steps to Enhance a Chart Using Do More...
The example in this section illustrates how to use Do More... to enhance your existing Cognos Workspace workspace using Cognos Workspace Advanced. If you do not see this option available to you, you might not have permission to use Cognos Workspace Advanced. As you go through the exercise, notice the other options available to you to enhance the workspace because not all options are illustrated in the following example.
1. In Cognos Workspace, open SampleOutdoor Returns by Order Method workspace.
2. Click anywhere in the Chart widget. This displays the Widget toolbar.
3. On the top right of the widget, click the Do More... button (looks like a star), as shown in Figure 8.54.
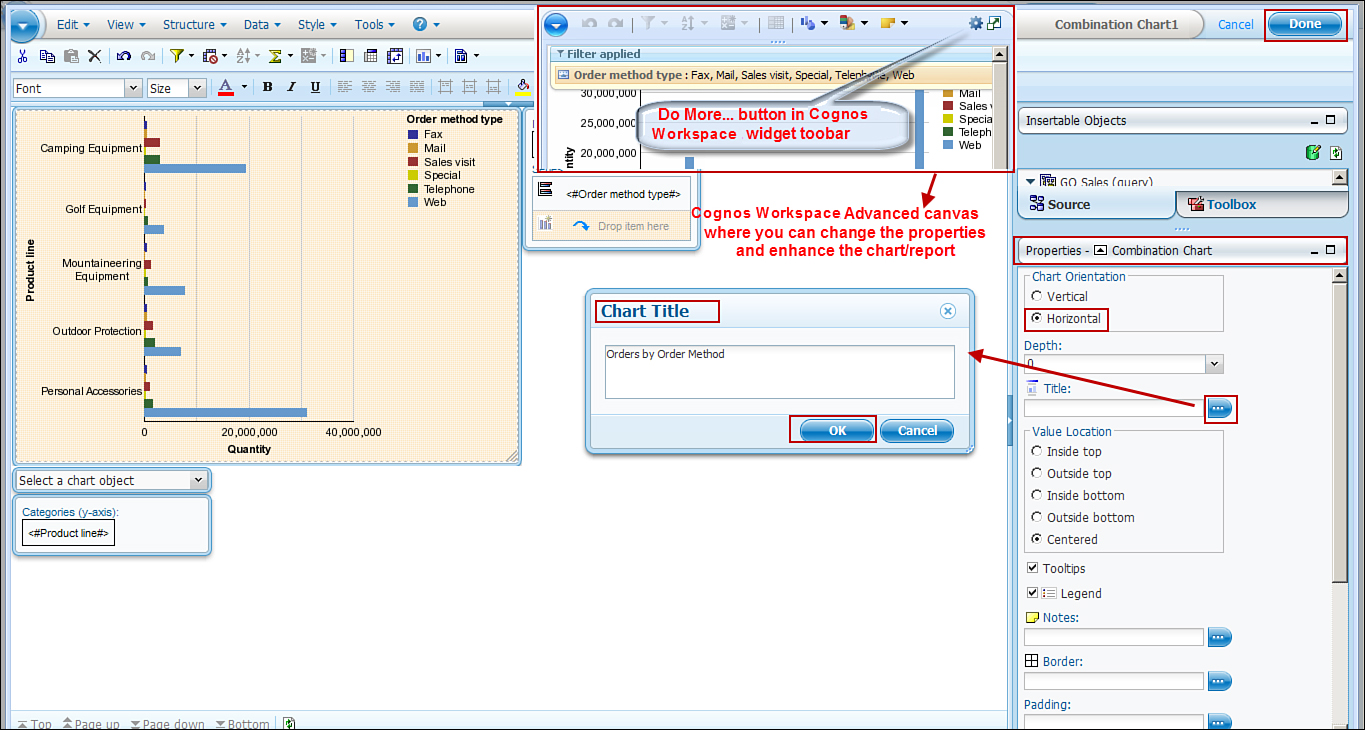
Figure 8.54. Launch IBM Cognos Workspace Advanced via the Do More... button.
Ensure the user interface has changed; you are now in Cognos Workspace Advanced.
4. Click the chart.
5. On the bottom right of the screen, click to maximize the Properties section.
6. Change the Chart Orientation to Horizontal.
7. In the Title section, click the ellipses in the Chart Title window, type Orders by Order Method, and click OK.
Ensure the changes take effect immediately.
8. Click the Done button on top right of the screen to exit Cognos Workspace Advanced and return to the workspace in Cognos Workspace.
Alternatively, to discard the changes and return to Cognos Workspace, you can click the Cancel link on the top right of the screen.
9. In Cognos Workspace workspace your chart now displays horizontally and displays the title you provided.
Advanced Techniques
You can access additional interactivity via the Do More... function. As you saw in the Do More...section, clicking this button takes you to Cognos Workspace Advanced. You can click the Done button to return to Cognos Workspace after you complete your tasks in Cognos Workspace Advanced.
You may want to filter the data in the workspace widgets using a column that is not currently displayed in your report widget. In such situations Cognos Workspace enables you to add a query in Report Studio named _BusinessInsight_. You can then use this data item in the filter widget to filter the data in the report widgets. Repeat this in all the reports you use in your workspace that require the data to be controlled via the filter.
Business Case
The requirement is for you to create a workspace that displays the products ordered via different order methods and analyze the returned products by order method. You want to ensure that appropriate steps are taken to reduce the impact of returned products over the period of time (trending over time). So you want to analyze the data over last few years; however, the year column is currently not in the report. You enhance the report using Report Studio.
To use this technique, you must have privileges required to launch and work with Report Studio in your IBM Cognos BI environment.
You can use two Report Studio reports that exist in the SampleOutdoorReports folder that is currently used in the workspace in question. The report and the report columns are as follows:
• Products by Order Method is a Column chart, with Quantity as the measure, Order method as Series, and Product Line as Categories.
• Returned Products by Order Method is a List report that displays Product Line, Order Method, and Return Quantity.
Although you need to analyze the data across years, the Year data item is currently not included in either of the reports, for example, Products by Order Method and Returned Products by Order Method.
Using the advanced technique you can update the reports in Report Studio to accomplish the same.
To use a _BusinessInsight_ query, perform the following steps:
1. Click the New Workspace icon on the Application bar to create your new workspace.
2. From the Content pane > SampleOutdoorReports folder, drag and drop the report part List1from the report Returned Products by Order Method onto the workspace.
Examine the report columns.
3. From the Content pane > SampleOutdoorReports folder, drag and drop the report partCombination Chart1 from the report Products by Order Method onto the workspace.
Examine the report columns: Product Line, Order Method type, and Quantity. Notice that the Year column is not in the report. So, you need to create a _BusinessInsight_ query with the Year data item to resolve this.
4. Drag and drop a Slider Filter onto your workspace.
Examine the data items available to you for filtering the data—there is no Year column in the Data Item list for you to pick, as shown in Figure 8.55.
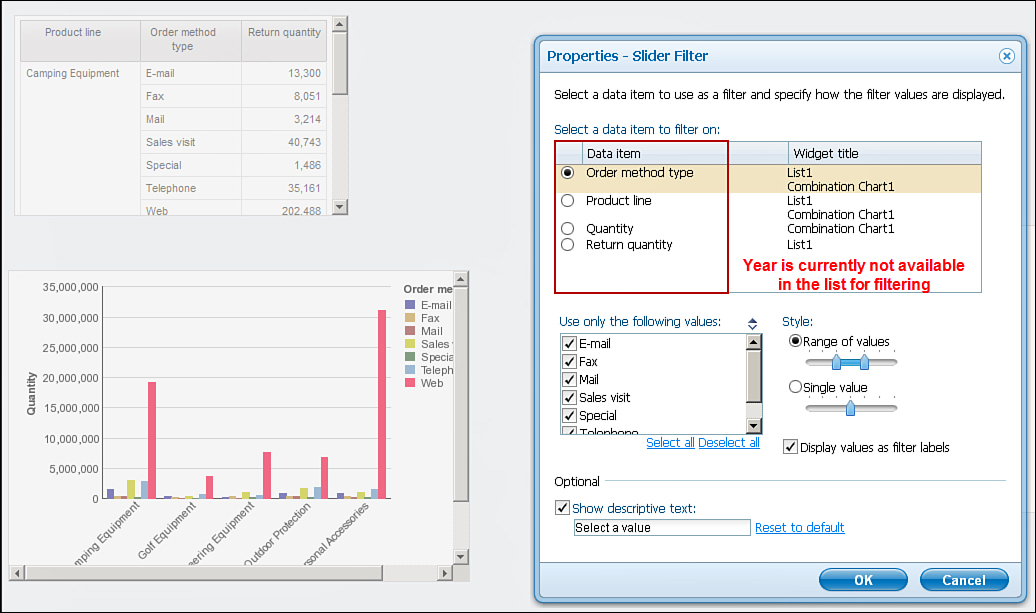
Figure 8.55. Slider Filter Configuration prior to adding Year.
5. Click the Actions menu > choose Launch > Report Studio. From the list of packages, choose Go Sales (Query). Select the Open Existing option and open the Products by Order Method report from the SampleOutdoorReports folder.
6. In Report Studio, navigate to the Queries pane. From the Insertable Objects pane, drag and drop a Query to the right pane, as demonstrated in left box in Figure 8.56.
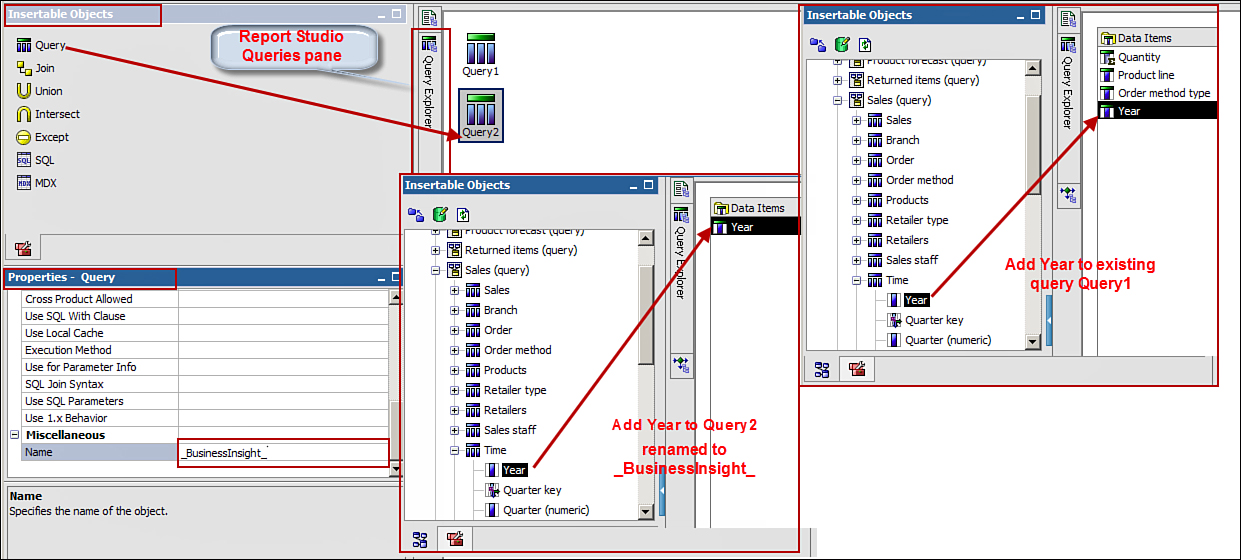
Figure 8.56. Modify queries in Report Studio to add Year.
7. In the Properties pane for the new query, change the name to _BusinessInsight_ (case-sensitive).
8. Double-click the new query _BusinessInsight_ and navigate to the Sales (query) namespace> Time dimension. Drag and drop the Year query item under Data Items on the right, as shown in the center box in Figure 8.56.
9. Navigate to the primary query, for example, Query1 in the Queries folder. Drag and drop the Yearquery item from the Time dimension into the query (refer to the right box in Figure 8.56).
10. Save the report.
11. In Report Studio, open the next report, that is, Returned Products by Order Method.
12. Navigate to the Queries folder, and drag and drop a Query from the Insertable Objects pane onto the right pane.
13. In the Properties pane for the query, change its name to _BusinessInsight_.
14. Double click the query _BusinessInsight_, in the right pane, and from Returned items (query) namespace > Time dimension, drag and drop the Year query item under Data Items on the right.
15. Navigate to the Queries pane, and double-click the primary query, for example, Query1.
16. Drag and drop the Year query item from Returned items (query) namespace > Timedimension under Data Items on the right.
17. Save the report.
18. Choose File > Exit from the menu to close the report, and return to the workspace in Cognos Workspace.
19. From the On-Demand toolbar, Widget Actions menu > select Reset. Repeat this for all the widgets in the workspace. Reset refreshes the report/chart in the widget with the changes you just made in Report Studio, shown as 1 in Figure 8.57.
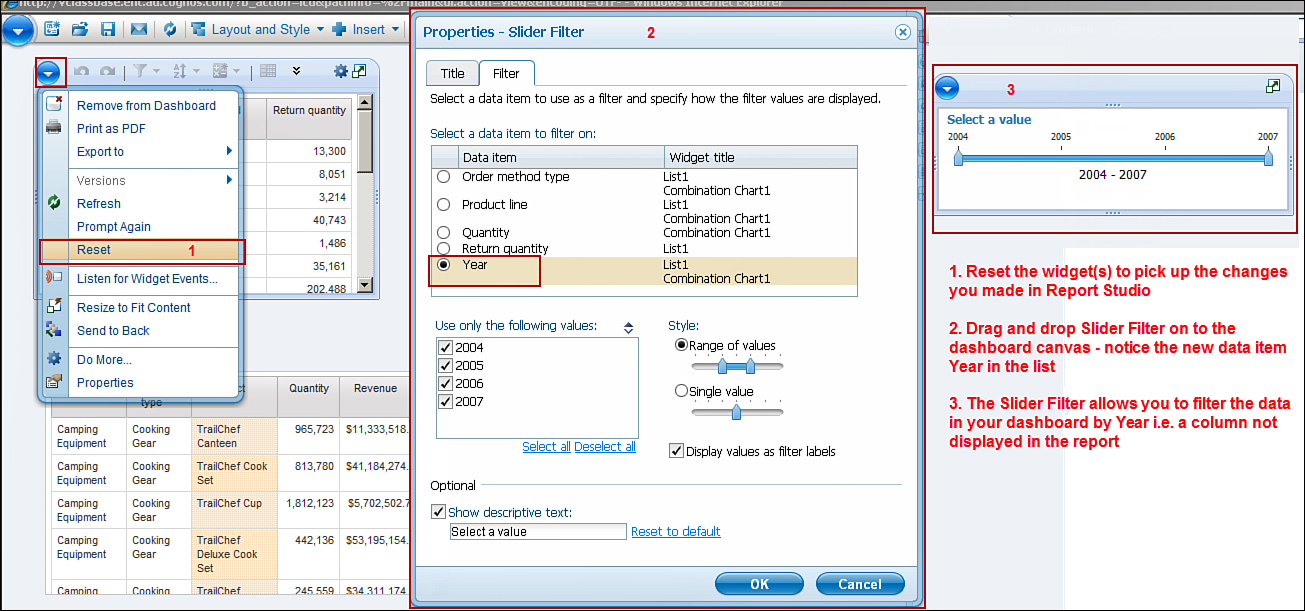
Figure 8.57. Slider Filter setup after Report Studio queries are modified, including Year.
20. Navigate to Content pane > Toolbox tab, and drag and drop a Slider Filter onto your workspace.
22. Click OK.
23. Change the filter to 2005 using the Slider Filter, and ensure the data in the two widgets change.
24. You have now added a filter to the workspace using a data item that is not displayed in the workspace.
Using Bidirectional Languages in the Workspace
Bidirectional language support enables you to use languages such as Arabic, Hebrew, Farsi, and Urdu in your workspace. Cognos BI bidirectional support includes digit shaping, bidirectional text, and object direction in the reports.
You must first enable bidirectional support in Cognos Workspace. To enable bidirectional support click the Actions menu in the Application bar > My Preferences ... > select the Enable bidirectional support check box > for Base text direction for content > select the appropriate value from the list, that is, Right-to-Left, Left-to-Right, or Contextual > click OK, as shown inFigure 8.58.
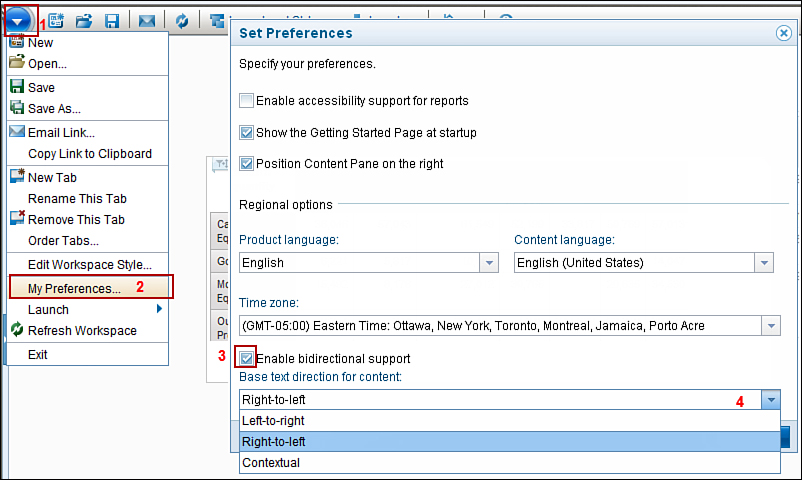
Figure 8.58. Set My Preferences for bidirectional support.
When you choose Contextual, the first letter of the text determines the direction. For example, if the first letter belongs to a language that is right-to-left (such as Urdu), then the direction will be right to left; otherwise, it will be left-to-right.
For more information refer to the “Bidirectional Support” section in Chapter 10, “IBM Cognos Report Studio.”
LEGACY GO!DASHBOARD USERS
Go!Dashboard is the Cognos component for creating dashboards in Cognos 8.4. If you have been using Go!Dashboard and are now upgrading to IBM Cognos 10 BI, Cognos Workspace is your logical upgrade path.
To upgrade a dashboard created in Go!Dashboard, you should open the dashboard in Cognos Workspace and save it. Cognos Workspace can directly open Go!Dashboard dashboards by upgrading the Go!Dashboard dashboard on-the-fly in the memory. When you save the dashboard in Cognos Workspace on top of the old dashboard, it is permanently upgraded. If you want to retain the originalGo!Dashboard dashboard, you should save the original with another name prior to upgrading.
Cognos Workspace provides additional capabilities that you can leverage including those that currently exist in Go!Dashboard with the exception of Flash-animated charts.
Chart animation is not enabled in Cognos Workspace by default; however, if your Go!Dashboarddashboards include charts with animation, you still can use those by adding an advanced property in IBM Cognos Configuration, which must be enabled by your IBM Cognos BI Administrator.
MULTILINGUAL SUPPORT USING COGNOS WORKSPACE
You can create a workspace that can be consumed by users in multiple languages. You need to create a single workspace and then configure it to be used in the required languages. This is also referred to as localizing the workspace.
The workspace may include data from single or multiple sources, widget titles, URLs, images, and so on. The report content that you drag and drop onto the workspace is built by report authors using Report Studio and must be configured by them to support your multilingual requirement. The metadata and the data should also support the multilingual requirement.
In the workspace you can localize the fixed content (for example, titles, images, static text, and web page references). You can also localize the filter content (for example, slider filter, select value filter, and filters added in the report widget). In addition, you can localize the List column headings and calculation names.
When you build a workspace, the default language and locale are determined by the initial content you add to the workspace. When you build your workspace in English, all the other languages and locales are in English until you change them.
The following steps define the process of how to localize a workspace to meet your multilingual requirement. These steps address the fixed content, filter content, and report content.
1. Create the workspace in the initial language and locale required.
2. Save the workspace.
3. Change the content locale of the workspace to a new locale required.
4. Modify the workspace object for the new locale.
5. Save the workspace.
6. Repeat steps 3–4 for each new locale required.
You have now created a workspace with locale-specific information in each of the workspaces to support your multilingual requirement.
INTEGRATING CONTENT INTO COGNOS WORKSPACE
You can integrate content into Cognos Workspace, integrate Cognos Workspace content into external applications, and collaborate using Lotus Connections.
When integrating content into Cognos Workspace, you can use external data via Images, RSS feeds, and HTML pages via the Image widget, RSS Feed widget, or Web Page widget. Also, your IBM Cognos BI Administrator must include the servers in the valid domain list in IBM Cognos Configuration.
In addition, Cognos Workspace can integrate with other Cognos applications like Real-Time monitoring, TM1 (in memory OLAP server), PowerPlay Studio, and Metric Studio. To integrate Cognos Workspace with other Cognos applications it is mandatory that the applications share the same gateway, with exception of TM1. The applications must also share the same Authentication namespace, if you require Single-sign on (SSO) to work between the Cognos applications.
You integrate Cognos Workspace content into external applications by using the URL to the Cognos Workspace workspace from Cognos Connection. Navigate to the workspace location in Cognos Connection and via the Set Properties > View Search path, ID and URL option > copy the Default Action URL to the clipboard. This URL will launch the workspace in Chromeless mode in a new window. If you want to open the workspace in the same window, paste the workspace URL in any text editor and change the following:
Locate the &m_redirect_windowmode=2 parameter, and change the value from 2 to 0. After the change it should look like
&m_redirect_windowmode=0
Use this URL in the application.
You can also use Cognos Workspace workspace in supported third-party portals: IBM WebSphere Portal, SAP Netweaver Portal, and Microsoft SharePoint.
IN A NUTSHELL: REVIEWING BY IBM COGNOS BI AUDIENCE
Depending on your role in IBM Cognos BI project implementation, you may be interested to know those aspects of using the IBM Cognos Workspace that relate to you. Now review IBM Cognos Workspace by role at a high level.
Architect Perspective
Architects are usually responsible for the overall technical implementation of the BI solution. It is important for you to understand the audience who will be using Cognos Workspace and how many users and what kind of workspaces/dashboards will be required. Answers to these questions can help you to plan, design, and implement the workspace/dashboard requirements that users can easily find and use without compromising on performance. Some of the key questions that you may want answered early are:
• Who is the audience for whom Cognos Workspace is a perfect solution? Although anybody in the organization who creates self-service dashboards can benefit from using Cognos Workspace, you should consider recommending it especially for business users/managers who need to create dashboards/workspaces often to analyze and interact with data and also share it with others. Other key features that users always seek is to change the sorting as they require based on individual preference, filtering, changing the display type based on individual preference, and interactivity.
• Cognos Workspace enables its users to work with the existing trusted content by simply dragging and dropping the content onto the workspace. IT does not need to create the data source for them again.
• Business users want to use a report in different formats for different audiences, for example, a chart is useful for higher management, whereas business analysts may want to see the data behind the chart and prefer a list or crosstab report. In such a situation, you do not need two different reports because Cognos Workspace enables you to change the display type. You can change the display type of the same report and share with your audience in a way that is most suited for them, thus allowing reuse of existing content.
• Recommend Cognos Workspace as an option when users currently collaborate with others in the team via attachments in emails. Such users/teams can benefit greatly by using the Lotus Connections collaboration features and create corporate memory.
• This is an appropriate solution for users who always need to create a one-off report however have significant dependencies on IT.
• On the performance front, ensure that users of Cognos Workspace are educated with the Leading Practices so they can benefit most from it.
• Cognos Workspace is the recommended upgrade path for legacy Go!Dashboard customers. Go!Dashboard objects can be directly upgraded to Cognos Workspace.
• Use content from Cognos Workspace or Report Studio content to provide better performance as compared to using Query Studio queries or Analysis Studio analysis.
• More widgets in the workspace may result in more trips to the server and may be costly. Educating the users can help them create efficient and meaningful workspaces.
Project Manager Perspective
Project Managers are interested in knowing if Cognos Workspace has been identified in the recommended BI solution. If it will be used what are the related tasks, skills, and resources required to implement the tasks and what phase do these belong to? Here are some points to consider:
• Cognos Workspace is an end-user Cognos component that is best suited for business users/managers who need to create their own self-service dashboards and/or collaborate with others on the result. Who are they and how many in numbers? Answers to this can help you ensure that the required licenses are available for use.
• Although Cognos Workspace is easy to use, its users can benefit tremendously through formal training. Ensure trainings are identified and scheduled where appropriate depending on the audience and culture.
• If your project includes an upgrade of Cognos Go!Dashboard to Cognos 10.x, see the section “Legacy Go!Dashboard Users.”
• Cognos Workspace typically uses existing Cognos content, for example, reports from Report Studio, TM1 cubes, PowerPlay cubes, and so on, and does not require a resource to specifically complete tasks within Cognos Workspace before the end users can start using it.
Business Analyst Perspective
Business Analysts should be familiar with the features of Cognos Workspace. It is easy to use with drag-and-drop capability and easy-to-create calculations, filters, comments, sorting, and change display types to name a few. Cognos Workspace is appropriate for customers who often create self-service dashboards. Its WYSIWYG (What-You-See-Is-What-You-Get) canvas makes it easy for business managers to build their own dashboards/workspaces. Some of the key requirements to gather are:
• Does there currently exist a group of users who need to build their own dashboards/workspaces and collaborate with others on the result? Who are they? How many in numbers? After you have this information, work with the BI Architect and the Project Manager to ensure sufficient licenses exist. They may need to work with the key stake-holders if required.
• Are there many one-off reports that users request from IT? You should analyze the content of these reports and can help scope the base reports, which users can then drag and drop on to the workspace.
• Quite often end users are not familiar with collaboration features available to them within the reporting tool. You may want to share with them the capabilities/features so that they can start to plan and use the same to enhance their corporate memory. Time saved is money/time earned!
• After you have gathered the entire reporting requirement, you should carefully analyze if there are similar reports being requested in different formats, for example, the same report content as a list report, crosstab, or chart. Such reports are good candidate for Cognos Workspace because they enable List and Crosstab to be converted to charts using menu options. Users can also switch from one chart type to another and change the default grouping in the report or resize the content.
• You should understand your audience and the culture. Some may be familiar with reporting tools and can easily self-learn, whereas others may be new and can benefit from training. Being familiar with the best practices can help them create better dashboards/workspaces.
• Is there a requirement for end users to drill-up/drill-down the data in the report? Which reports are those? Carefully capture this requirement and share it with the Metadata modeler because it should be modeled differently.
• Although Cognos Workspace has many powerful capabilities that end users can work with, it may not be the right choice for everyone. You must carefully understand the audience and their needs and identify the best choice for them. In certain cases you will find that there are some for whom Active Reports is the appropriate choice, whereas others are more suited for Report Viewer or Portal Pages.
• Your understanding of Cognos Workspace can help you guide business users to make informed decision on how to tap into the power of Cognos Workspace and create meaningful and efficient dashboards/workspaces. Too many annotations, sort, drill, and filters may not result in a perfect dashboard/workspace because the more widget-heavy the workspace becomes, the more the chances of it impacting performance increases. Although this might not always be true depending on the underlying query, you should work with the business users to help them understand the same and guide them to formal training when required.
Developer Perspective
Developers must thoroughly understand the requirement around customer’s need for workspace/dashboards and their audience. You must give careful consideration to some of the points highlighted here:
• Ensure that the report, report parts, charts, and so on, have logical names that make it easy for the business users to identify the report part when they drag and drop objects onto the workspace.
• Do not leave the usable objects with default names of List1, Crosstab1, and so on because when these objects are exposed in Cognos Workspace, the users do not know what the content is.
• Work with the Business Analyst to understand your audience. This can help you organize the content required by Cognos Workspace users into folders as reports that are maybe smaller and more manageable by workspace/dashboard users. These folders can then be appropriately secured.
• Do you have a choice to make between easy to implement and easy to maintain? Discuss your options with the Architect, BI Administrator, or other stakeholders, if required.
• Are there specific requirements regarding a need for data to be modeled dimensionally or relationally? This depends on if drill-up/drill-down capabilities are required.
• Understand the degree of interactivity required on the workspace, which can help you evaluate its data source. Where applicable you can use TM1 Cube views or PowerCubes that provide improved query performance.
• Prompts must be specifically named for them to show up in Cognos Workspace for end users to use them.
• For reports with global filters, author a report with one master query that is referenced by all data containers, and add optional parameterized filters to all the data items to easily hook up global prompts.
End-User Perspective
End Users who are business users/managers can especially like Cognos Workspace. Some of the things you should think about, as a starting point, are listed here:
• How do I know if this is the right tool for me? If you are a business user/manager who is always creating one-off reports for yourself or others by changing display types, sort, calculations, or filters, Cognos Workspace should help ease your work tremendously.
• If you will be using Cognos Workspace, remember to use the leading practices. For example, wherever possible you should work with report parts rather than the entire report. Resist the temptation to drag and drop all the information on one workspace/dashboard for two reasons: smaller workspaces/dashboards are more readable/manageable and provide better performance.
• Work with your Business Analyst to ensure that the information you require to build workspace/dashboards will be available to you as an existing IBM Cognos content, for example, Report Studio report, TM1 cube, and PowerPlay cube. You need to ensure that it will be available for your use in Cognos Workspace and where to find it.
• You can email the workspace/dashboards to others and collaborate with your team.
• If you are not familiar with collaboration features and you currently share your findings with the team, you may want to explore the Lotus Connections features available in Cognos Workspace.
• Slider filters shows data that is available when it was created. To refresh the data in the Slider Filter to pick some recent updates, you must reconfigure the Slider filter. For example, if you created the Slider filter in 2011 and use your dashboard in 2012, 2012 will not show up in the filter by default. You must reconfigure the Slider filter if you require 2012 to show up. This is not a bug—it is by design.
• Using a Report Studio or Cognos Workspace content can yield better performance over content from Query Studio and Analysis Studio.
• More does not always mean meaningful. Too many widgets on the workspace/dashboard may create a cluttered and busy workspace/dashboard, which is not easy to understand. It can also add a burden to unnecessarily make calls to the server for information that may not be critical, however, which was dragged on to the workspace/dashboard with other objects, thus negatively impacting performance. You should resist the temptation to drag everything onto the workspace/dashboard without careful consideration.
IBM Cognos BI Administrator Perspective
IBM Cognos BI Administrators should work together with the team to guide them to build a robust solution that yields good performance. There are many situations in which a choice must be made between easy to implement and easy to maintain. You can help the team make the right decision based on the infrastructure, unique customer situation, and culture. Some of the points worth considering are:
• You should work together with the team to decide if all Cognos content is relevant and needs to be exposed to all Cognos Workspace users. You may find, more often than not, that only certain content is applicable to build the workspace/dashboard. Work with the team to arrive at a design that organizes content required for Cognos Workspace into separate folders that can be exposed accordingly. Usually the content would be a smaller and more manageable report relevant for building workspaces/dashboards.
• Work with the team to arrive at the appropriate data source based on customer requirements. Analyze the level of interactivity required. In each case, situations in which a high level of interactivity is required, guide the team to use TM1 or PowerCubes where applicable for improved query performance. Wherever possible you may use Power-Cubes as a data source, which can provide a richer set of functions and enhanced performance as compared with other data providers.
• You should upgrade the reports when importing a deployment for enhanced performance in Cognos Workspace. By using upgraded reports you save on-the-fly upgrades when you drag and drop objects on to the workspace.
Nice to read your article!very informative post. So,please keep posting.
ReplyDeleteCognos TM1 Online Training india
Nice post, check it once through Cognos TM1 Online Training Bangalore for more information.
ReplyDeleteNice post ! Thanks for sharing valuable information with us. Keep sharing..Cognos TM1 Online Course Hyderabad>
ReplyDeleteVery Nice Blog with very Unique Content.Please update Big data blog also.
ReplyDeletecognos training online
cognos training
learn cognos online
cognos online classes
Thanks a lot for sharing a valuable blog on Cognos. I was browsing through the internet looking for Cognos training and Cognos Interview Questions and came across your blog. I am impressed by the information that you have on this blog. It shows how well you understand this subject, you can find more information here about Cognos and Cognos Interview Questions
ReplyDeleteIm no expert, but I believe you just made an excellent point. You certainly fully understand what youre speaking about, and I can truly get behind that.
ReplyDeleteSharePoint ticketing system
Best virtual mailbox service massachusetts I think this is an informative post and it is very useful and knowledgeable. therefore, I would like to thank you for the efforts you have made in writing this article.
ReplyDelete