Query Studio
Query Studio is a core IBM Cognos BI component and is installed as part of the IBM Cognos BI Server install. It is an end-user ad-hoc query tool for business users and business analysts who need to explore the data to quickly answer various business questions. Query Studio is easy to use and requires little or no training.
Query Studio uses relationally and dimensionally modeled data and uses the same administration process and security already defined in the IBM Cognos BI environment. It is a web-based component used to perform analysis and explores data to answer simple business questions quickly. Like any other tool, you should be familiar with your organization’s data to build meaningful queries.
Cognos Workspace Advanced is the logical upgrade path for IBM Cognos BI V10.x users that brings together Query Studio, Analysis Studio, and Report Studio Express features, all in one place. If you are a legacy IBM Cognos 8.x user, you can continue to use your queries from IBM Cognos BI 8.x in IBM Cognos BI v10.x; however if you plan to build new reports for query and analysis, it is recommended you tap into the rich capabilities of IBM Cognos Workspace Advanced.
LAUNCH QUERY STUDIO
You can launch Query Studio from the Welcome screen by clicking Query my data under My Actions section or from the IBM Cognos Connection launch option, click Launch > Query Studio.
When you launch Query Studio, you must select a package that contains the metadata for your reporting, for example, Go Data Warehouse (query). You can work with both dimensional and relational packages; although, relationally modeled data is more suited for Query Studio. You can work with one package at a time.
When you launch Query Studio and choose a package, you are taken to a blank Query page with data items and other prebuilt objects such as filters available in the package in the Menu pane.
Before you start creating your report using Query Studio, you must ensure that the metadata is available via a Framework Manager package and has been published to IBM Cognos Connection. You should also ensure that the package contains all the information you need to build your report.
QUERY STUDIO HIGH-LEVEL INTERFACE
Query Studio interface is easy to use and consists of the following main areas: Menu pane, Standard toolbar, Style toolbar, Information pane, and the Work area, as shown in Figure 5.1.
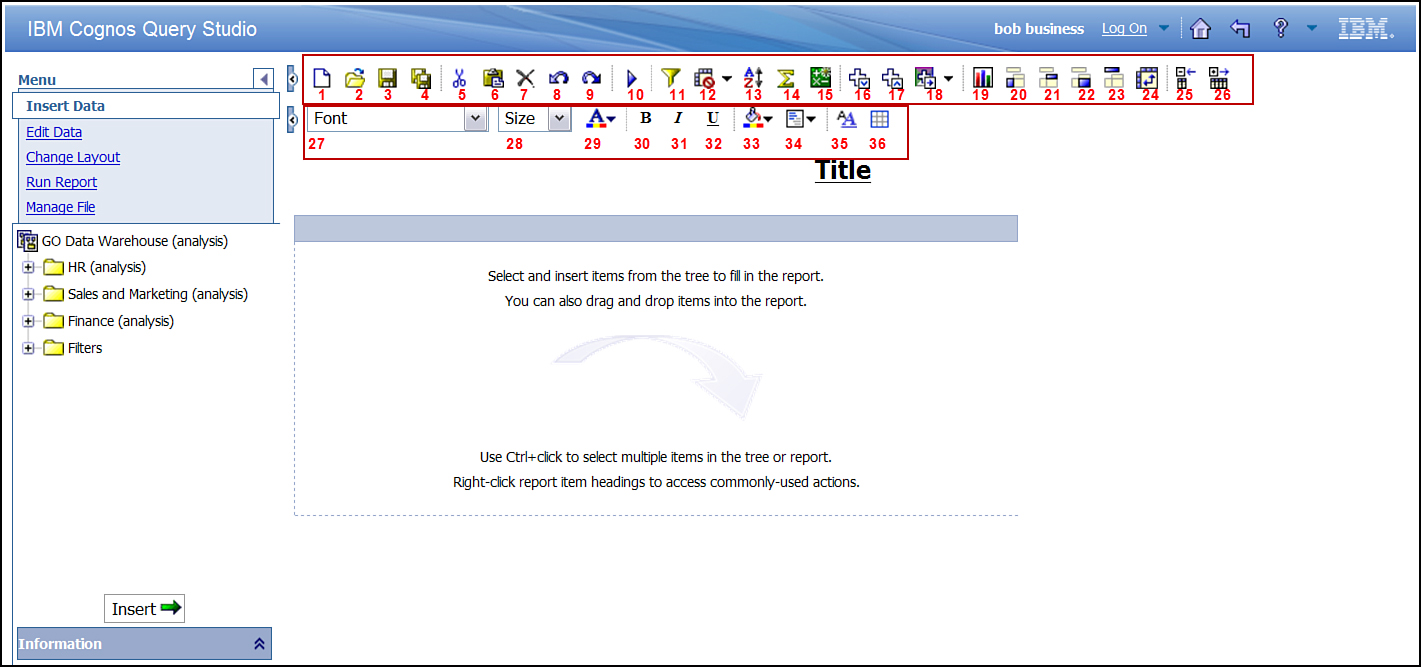
Figure 5.1. Query Studio – high-level interface.
The Menu pane has Insert Data, Edit Data, Change Layout, Run Report, and Manage Fileoptions. Commonly used features discussed here also display in the Standard toolbar for easy access. Each option is discussed in the sections that follow.
Insert Data
The Insert Data menu enables you to add data items from the data tree to the report. It consists of three options:
• Package Structure: Displays the data tree of data items in the selected package that you can use to build your report
• Insert button: Adds the selected data item to the report in the work area
• Information pane: Displays related information on the selected data items enabling you to confirm that the selected item is the one that you want to work with
Edit Data
The Edit Data menu enables you to work with data in your report and enhance your report by using options such as sort, suppress, filter, create calculations, and so on.
• Combine Filters: Enables you to combine two or more filters to create a complex filter condition.
• Suppress: Enables you to suppress rows with Zero values, Divide by zero, Missing values, andOverflow values from the report, as shown as 12 in Figure 5.1.
• Sort: Specifies sort options as Ascending (A–Z), Descending (Z–A), and Don’t sort. Sort option is shown as 13 in Figure 5.1.
• Summarize: Adds or removes footer values and changes how the footer values are calculated. You can choose a function appropriate for summarizing the data in the report, for example, Total,Maximum, Minimum, Median, Average, Standard Deviation, Variance, Count, Count Distinct, None, as shown as 14 in Figure 5.1. The options available to you are context-sensitive and depend upon the selected item in the report.
• Format Data: Specifies additional data formatting. The options available vary depending upon the item selected in the report. For numeric values you can specify the category of the item, for example.Currency, Number, Percentage, and Scientific. Depending upon the category you specify, the related additional options such as scale, number of decimal places, and more can be specified.
• Calculate: Enables you to create calculations, for example, items not already in the database, as shown as 15 in Figure 5.1.
• Define Custom Groups: Enables you to group columns in the report into other meaningful groupings required by the business for analysis.
• Go To: Displays links to any related target reports; clicking the link takes you to the selected report, as shown as 18 in Figure 5.1.
• Rename Column Heading: Enables you to change the default column heading.
• Delete: Enables you to delete the selected item and remove it from the report, as shown as 7 inFigure 5.1.
Change Layout
The Change Layout menu enables you to enhance the look and feel of the report by adding a title to the report, change fonts and styles, group the data, apply page breaks, and more.
• Chart: Displays the data in a chart form. You can choose from a variety of chart types, for example, pie, bar, line, gauge, scatter, and more, as shown as 19 in Figure 5.1.
• Define Conditional Styles: Highlights important information in the report when a business condition is satisfied.
• Change Font Styles: Formats an object in the report, for example, font, font size, font color, or the font background color, as shown as 29 in Figure 5.1.
• Change Border Styles: Enables you to format the borders of tables and sections in the report, as shown as 36 in Figure 5.1.
• Reset Font and Border Styles: Enables you to restore the styles from the template after making a change.
• Apply Template: Enables you to change the default systemwide Query Studio template to another template and give it a new look. The new template must be created in Report Studio and then used in Query Studio.
• Edit Title Area: Specifies the title and subtitles for the report.
• Set Web Page Size: Enables you to specify the number of rows you want to display on the screen.
• Set Page Breaks: Enables you to specify the page breaks based on a grouped or sectioned column. Each value of the grouped/sectioned column appears on a new page.
• Ungroup: Display repeated values in the report by removing the grouping applied via Group option, as shown as 22 in Figure 5.1.
• Create Sections: Enables you to break the report into different sections based on the column you choose to section on. The column used for creating a section displays as the section header, as shown as 23 in Figure 5.1.
• Swap Rows and Columns: Changes the existing rows in the report as column values and columns as rows to get another perspective of the same data, as shown as 24 in Figure 5.1.
• Collapse Group: Temporarily removes progressive levels of detail from the report, as shown as 25 in Figure 5.1.
Run Report
The Run Report menu enables you to specify the report output type, such as PDF, Excel, and more. You can also enable or disable drill up, drill down, and drill through options from here as well as control summary options.
• Run with All Data: Runs the report using all the data from the data source, as shown as 10 inFigure 5.1
• Preview with Limited Data: Runs the report using partial data from the data source and works only with relational data source. Rollups are not computed in this mode. Reports based on packages with design filter have improved performance in this mode.
• Preview with No Data: Runs the report using no data and is typically used during designing the report.
• View in PDF Format: Enables you to generate the report output in PDF.
• Specify PDF Options: Enables you to specify the orientation and page size of the PDF report.
• View in Excel 2007 Format: Enables you to generate reports that you can view in Microsoft Excel 2007.
• View in Excel 2007 Data Format: Enables you to render the data for a list report to view in Microsoft Excel 2007.
• View in Excel 2002 Format: Enables you to generate reports that you can view in Microsoft Excel versions earlier than 2007.
• View in CSV Format: Enables you to view list reports in Comma Separate Values (CSV) format.
• View in XML Format: Enables you to view the report in XML format.
• Advanced Options: Provides two runtime options that you can enable or disable via check boxes.
Query Options:
• Automatically Generate Footer Summaries for Measure: Turn off the automatic generation of summaries for measures by clearing the check box.
• Automatically Summarize Detail Values, Suppressing Duplicates: Turn off the automatic suppression of duplicates of detail values by clearing the check box.
Drill Options:
• Enable Drill Up and Drill Down in the Report Output: Turn off the drill up and drill down functionality by clearing the check box. By default, drill up and drill down is enabled. This is applicable to dimensional reports only.
• Enable Drill Through from a Package in the Report Output: Enables or disables navigation to another report for detail information. By default, this option is enabled. You can navigate to another Query Studio report, Report Studio report, Analysis Studio Analysis, IBM Cognos Series 7 cube action, and a Microsoft Analysis action.
Manage File
The Manage File menu enables you to manage your Query Studio report. For example, from here you can open the Query Studio report with Report Studio, save the currently opened report, create a new report, or open an existing report. Some options available here are also available to you from other menu options.
• New: Enables you to create a new Query Studio report, as shown as 1 in Figure 5.1 on the Standard toolbar.
• Open: Enables you to open an existing Query Studio report, as shown as 2 in Figure 5.1 on the Standard toolbar.
• Open in Report Studio: Enables you to open the Query Studio report in Report Studio.
• Save: Enables you to save the report that you can use later, as shown as 3 on the Standard toolbar inFigure 5.1.
• Save As: Enables you to save the report with a new name and reuse the work done earlier, as shown as 4 on the Standard toolbar in Figure 5.1.
• Report Definition: Enables you to troubleshoot report problems. It has two options:
• Report Definition: Displays the expression for each report item.
• Query Information: Displays the query information for each report item. Using this option you can view the XML definition of the report; it is useful when troubleshooting with Cognos Support.
• My Preferences: Enables you to specify the default settings for your session. Changes you make here are valid for your session only and do not impact other users. Use this option to change the settings for the following:
Default data display:
• Run with All Data (default)
• Preview with Limited Data
• Preview with No Data
Default template:
• Apply a template (Select a template)
Default filter dialog for value selection:
• Default (default)
• Pick values from a list
• Search for values
• Type in values
Advanced Run-time Options:
• Query Options:
• Automatically generates footer summaries for measures
• Automatically summarizes detail values, suppressing duplicates
• Drill Options:
• Enables drill up and drill down in the report output
• Enables drill through from a package in the report output
Standard Toolbar Options
The Standard toolbar contains icons for frequently performed actions for easy access. These options are also available via the Menu pane and are discussed there. Standard toolbar options are demonstrated in Figure 5.1.
Options New (shown as 1 in Figure 5.1), Open (shown as 2), Save (shown as 3), Save As (shown as 4), Cut (shown as 5), Paste (shown as 6), Delete (shown as 7), Undo (shown as 8), and Redo(shown as 9), have same functionality as discussed in the section “Menu Pane” earlier in the chapter.
• Run: Enables you to choose the report output type, for example, HTML, PDF, Excel, CSV, or XML.
• Filter: Enables you to define a filter for the report to remove unwanted data. You can combine filters to create complex filter conditions using AND and OR operators.
• Suppress: Enables you to suppress row with Zero values, Divide by zero, Missing values, andOverflow values from the report.
• Sort: Specifies sort options as ascending or descending.
• Summarize: Enables you to create summary calculations for selected sets, for example, Sum,Average, Maximum, Minimum, Median, Variance, Standard Deviation, and Count.
• Calculate: Creates a calculation for one or more columns. Options available depend upon the number of rows (or columns) selected.
• Drill-Down: Displays lower levels of detail in dimensional reports. You can drill down in the report until you reach the lowest level.
• Drill-Up: Displays higher levels of detail in dimensional reports. You can use drill up until you reach the highest level in the report.
• Go To: Enables you to invoke a related Cognos report for further analysis.
• Chart Type: Enables you to choose a chart type appropriate for your analysis, for example, Column, Bar, Pie, Line, Pareto, Area, Radar, and Point.
• Group: Enables you to remove duplicate values in the report and display them as a group.
• Pivot: Creates a Crosstab report.
• Ungroup: Enables you to ungroup the column you grouped using Group.
• Create Sections: Enables you to divide the report based on a column on which you create a section. The sectioned column becomes the header and is removed from the list report. A section is created for each distinct value of the sectioned column.
• Swap Rows and Columns: Changes the existing rows in the analysis as column values and columns as rows to get another perspective of the same data.
• Collapse Group: Enables you to collapse the detail portions of the report and display only the high-level information. You can collapse only those reports that have a measure and do not have custom groups.
• Expand Group: Enables you to restore the collapsed information in the report. This option is applicable to reports that have a measure and do not contain custom groups.
REPORT TYPES
You can create both relational and dimensional reports using Query Studio. You should choose to create a relational report if you do not require drill-up and drill-down capability. Dimensional reports are appropriate if you need to drill up and drill down the data. The package type, relational or dimensional, is designed by the metadata modeler for you. Figure 5.2 illustrates the different options available to you in the relational and dimensional model, and how they appear in the user interface.
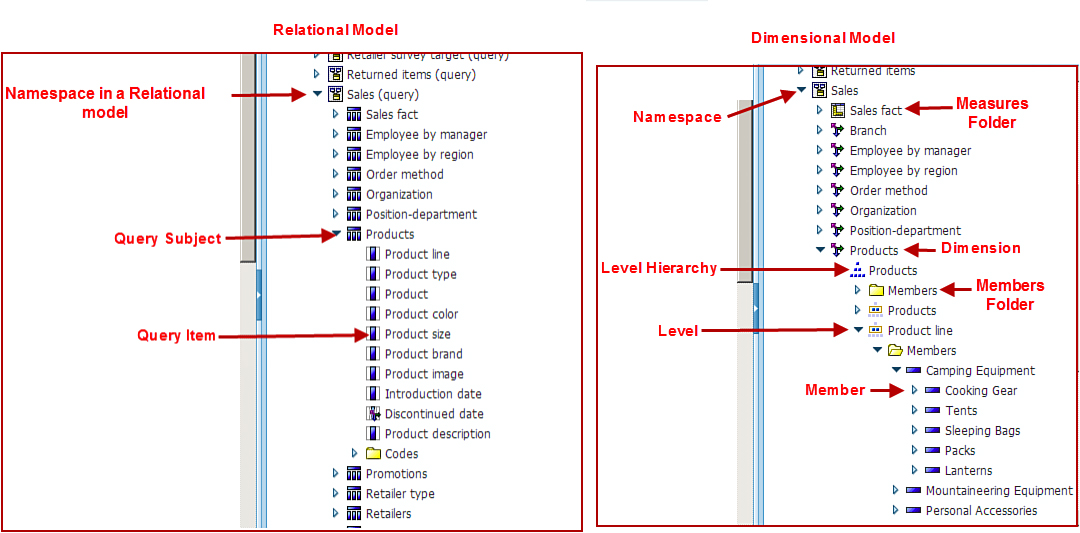
Figure 5.2. Relational and dimensional model structures.
Relational Style
Relational style reports use relational data sources. You can create List, Crosstab, and Charts using relational data.
In the Insert Data menu the metadata tree is organized in Namespaces, which contain Query Subjects, as shown in Figure 5.2. Query Subjects are like tables in a database that contain logically related items together. Query Subjects are made of one or more Query Items. You can compare Query Items to columns in a table. You may either drag and drop an entire Query Subject in to your List report or selected query items.
Dimensional Style
To work with dimensional style reports, you should work with dimensionally modeled relational data sources or an OLAP data source. When working with the dimensional style, the Insert Data menu shows in the data tree: dimensions and members.
Before you build your report in Query Studio, you should become familiar with the objects available to you in the dimensional model. Listed next are objects you can use to build your Query Studio report. These options are also illustrated in Figure 5.2.
Namespaces are logical or functional groupings of dimensions and measures.
Dimensions are logical groupings of descriptive data that aligns with a business function, for example, Branch, Order Method, Products, as demonstrated in Figure 5.2. Dimensions are further made up of levels, members, and hierarchy. Levels and members provide detailed information about the dimension.
Hierarchy is the further grouping of data within the dimension and determines the navigation paths available for the dimension.
Members contains members for the hierarchy or level.
Level defines the position within the dimensional hierarchy that contains information at the same level of detail with common attributes. Each level has its own set of items that show up as rows or columns in a crosstab report. This information is derived from the underlying data source.
The data tree may appear as shown in Figure 5.2, for example, Package > Folder > Namespace >Fact > Measure. In the same namespace you can have Dimension > Hierarchy > Level > Level Attribute > Member.
Dimensions, Measures, hierarchies, and more are explained in further detail in Chapter 11, “IBM Cognos Framework Manager.”
Using Query Studio you can build List, Crosstab, and Chart reports. One report type is not better than the other; the choice is typically guided by the preference of the report audience and purpose of the report.
List, Crosstab, and Chart Reports
A List report is a good option when you want to display detailed information in a tabular format. By default, repeated information displays multiple times until you group the data on one or more repeated columns as needed for your reports. Use the Group or Ungroup option from the toolbar. You can define Headers, Footers, and Summaries using a List report.
Crosstab reports are ideal for matrix type reports where you can have data items in rows and columns and numeric value, that is, a measure or metric, in the intersection cells. You can nest a Crosstab report by adding rows and columns or even measures. Crosstab reports enable you to enhance the reports and broaden the perspective using nested rows and columns. You can also display multiple measures in the same report to provide a comparison between different key performance indicators or metrics.
Use Charts to display data graphically. These are best-suited for showing key information quickly. There are many chart types available to you for use. Some of them are discussed later in this chapter. Query Studio supports Column, Line, Column and Line, Area, Bar, Pie, and Radar chart types. When working with charts you can choose the chart to be Standard, Stacked, 100 Percent Stacked, or 3-D Axis.
OPEN AN EXISTING REPORT
You can open an existing Query Studio report from IBM Cognos Connection, as shown in Figure 5.3. Clicking the report name or the query sign in the Actions column opens the report in Query Studio.
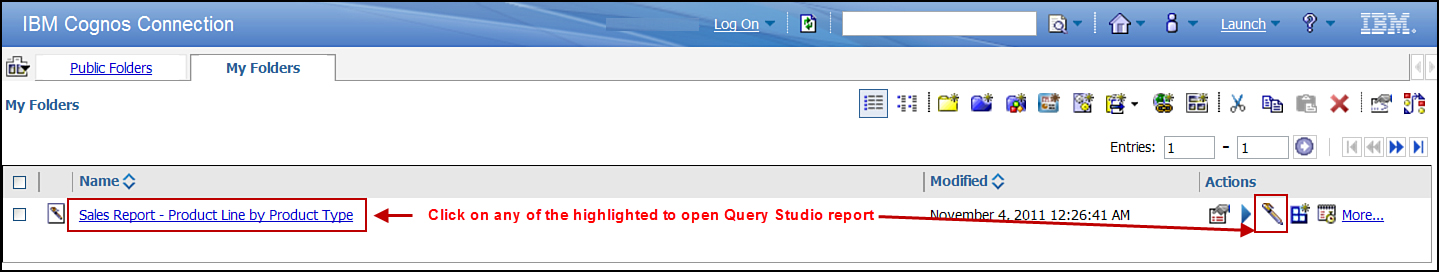
Figure 5.3. Open a Query Studio report.
CREATE A LIST REPORT
You can create a List report by inserting data items from the Insert Data menu. You can either drag and drop items from the data tree onto the work area (in certain browsers only) or use the insert button to add it to the report. When you use the Insert button, by default the column is added to the report as the rightmost column. However, if you click a column in the report and then click the Insert button, the new column is added to the left of the currently selected column in the report.
If there is more data than that can fit on a page, you see links for Page Navigation at the bottom of the work area, for example, Top, Page Up, Page Down, and Bottom. These links are context-sensitive and are available depending upon where you are in the report; for example, if you are on the first page of the report, the Top and Page up links will be disabled.
Top: Takes you to the first page, that is, the top of the report
Page up: Takes you to the previous page
Page down: Takes you to the next page
Bottom: Takes you to the last page of the report
NOTE: You can change the number of rows per page via the Change Layout > Set Web Page Size > Number of rows option.
Steps to Create a Report

Figure 5.4. Create a List report and Group on Product line.
1. In IBM Cognos Connection, click Launch > Query Studio.
2. Select GO Data Warehouse (query) package, when prompted to select a package.
3. In the Insert Data menu navigate to GO Data Warehouse (query) > Sales and Marketing (query) > Sales > Products > Product line > click the Insert button.
4. In the Insert Data menu navigate to GO Data Warehouse (query) > Sales and Marketing (query) > Sales > Products > Product type > click the Insert button.
5. In the Insert Data menu, navigate to GO Data Warehouse (query) > Sales and Marketing (query) > Sales > Sales fact > Quantity > click the Insert button.
NOTE: There are repeated rows for Product line.
Group Data
Group Data option enables you to group the data in report columns. You can group one or more columns.
To group data, perform the following steps:
1. Click Product line > click the Group icon on the Standard toolbar.
2. Right-click Sales fact > Revenue column > select Insert to add Revenue to the report.
NOTE: For Internet Explorer users, if you use the drag and drop option, remember you must drop the Revenue column only when you see three blinking lines indicating the drop zones. Also, examine that the Revenue column is automatically summed based on the grouped column.
RUN THE REPORT
To see the output of the report or to run the report in another format, that is, PDF, Excel 2007, and so on, use the Run Report menu option, as shown in Figure 5.5.
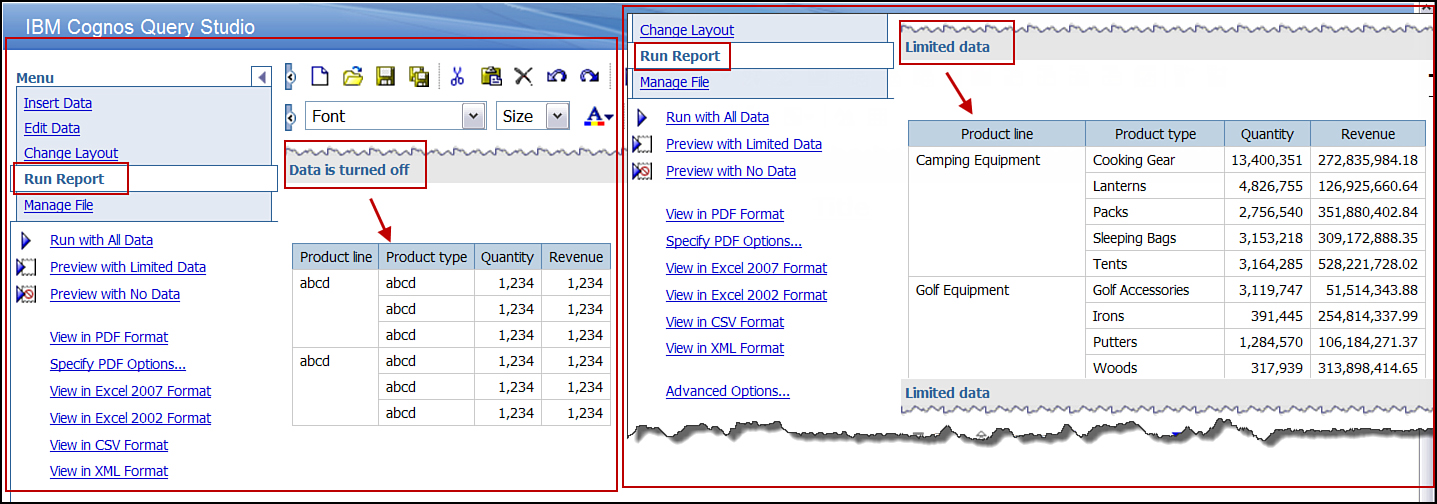
Figure 5.5. Run data options – preview with no data and preview with limited data.
When you run the report, you can choose to run it without any data (Preview with No Data), with limited data (Preview with Limited Data), or all data (Run with All Data). While designing the report, running with no data or limited data is a good option because it reduces the traffic to the server to retrieve data until you are ready to test the data in the report.
You noticed that summaries were automatically generated when you added a numeric column to the report. You can suppress this via the Run Report > Advanced Options... > uncheck theAutomatically Generate Footer Summaries for Measure option.
Running the report always displays current data from the database.
Steps to Run the Report
Figure 5.6 demonstrates steps to run a report in Query Studio as described in the list that follows.

Figure 5.6. Run a report.
1. Click Run Report menu > ensure Run with All Data is selected.
2. Click Specify PDF Options... > select Paper size A3.
NOTE: You can specify Orientation as Portrait (default) or Landscape via the radio button and enable or disable the Page scaling option via the check box.
3. Click OK.
4. Click Advanced Options... > under the Query Options section uncheck Automatically Generate Footer Summaries for Measures.
NOTE: You can also enable or disable the option Automatically Summarize Detail Values, Suppressing Duplicates (enabled by default).
5. Click OK.
NOTE: Notice that the Summaries are now removed from the report.
6. Click View in PDF.
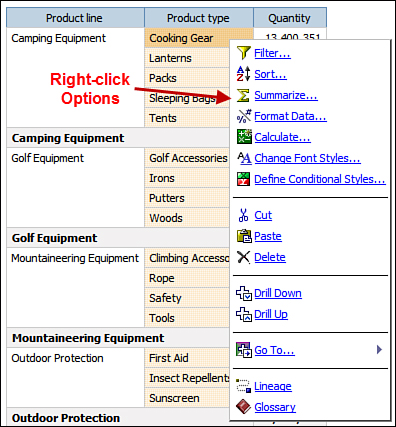
Figure 5.7. Options available via right-clicking.
Additional options are available to you from here, for example, Lineage and Glossary. The Lineageoption is available to you only if it has been configured by your Cognos BI Administrator. Lineage is helpful if you want to trace the data item in the report to its source, for example, which item it maps to in the package and the data sources the package uses. This is especially useful if similar data items exist in multiple data sources used in the package or report. It also enables you to view the filters applied by the data modeler and report author. You can either use the Lineage tool that comes with your IBM Cognos BI software or use another one that your Cognos BI Administrator can configure. The Glossaryincludes the terms and definitions in your IBM Cognos BI environment.
CHANGE LAYOUT
Change Layout provides options that enable you to enhance the report format and layout, for example, provide report title, hide or show filter, sort, and suppression options in the report, as illustrated inFigure 5.8 and described in the list that follows.
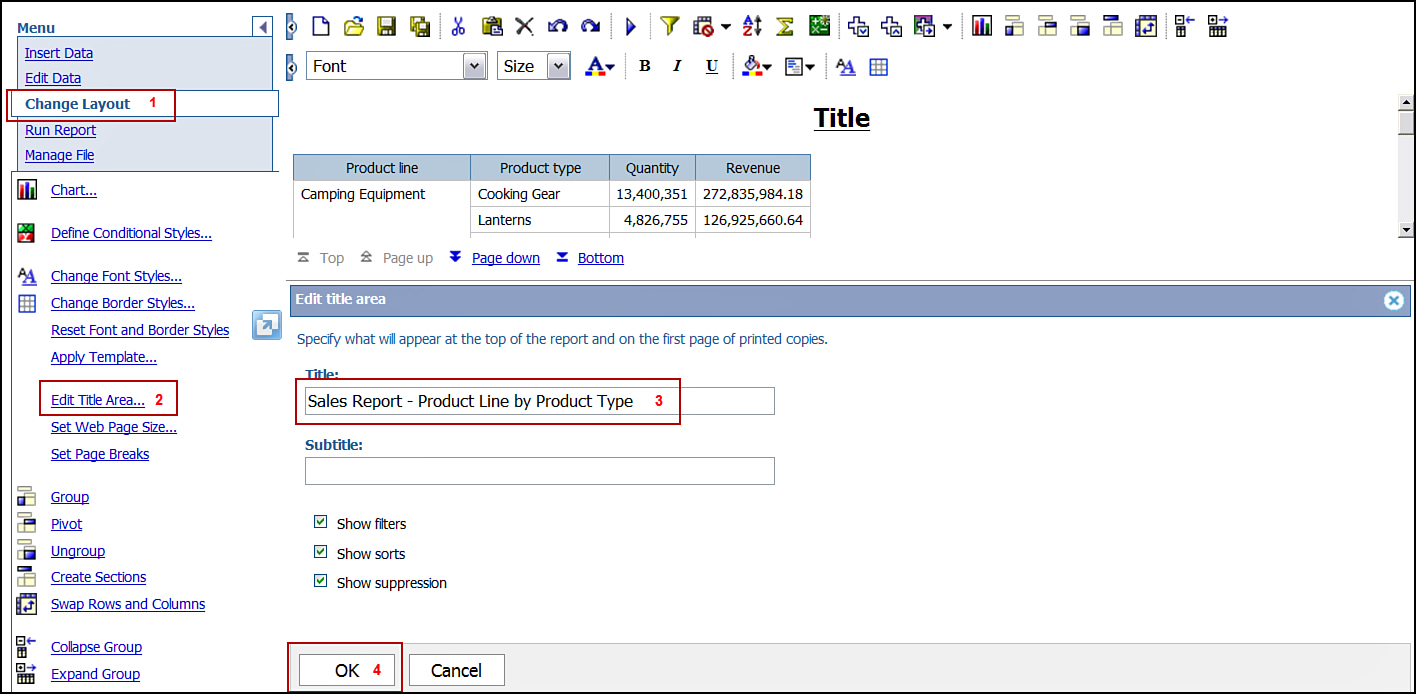
Figure 5.8. Change report title.
1. Click Change Layout > Edit Title Area... > Type Sales Report – Product Line by Product Type in the Title box.
NOTE: You can also provide a subtitle for the report here. By default any filter, sorting, and suppressions you have applied displays in the report; however, you can disable them by unchecking the options Show filters, Show Sorts, and Show Suppression, as required.
2. Click OK.
Page Breaks
You can specify page breaks in the report to print logically or functionally related data on the same page, described in the steps that follow.
1. Click the Product Line (or any grouped or sectioned column in your report) > Click the Set Page Breaks link (in the Change Layout menu), as shown in Figure 5.9.

Figure 5.9. Set page breaks in the report.
2. Click the Undo icon in the Standard toolbar to undo the page break settings.
Create Sections
The Sections feature displays the data in sections. Creating a section divides the data in the report by the column it is sectioned on. The sectioned column becomes the section header, as shown in Figure 5.10.
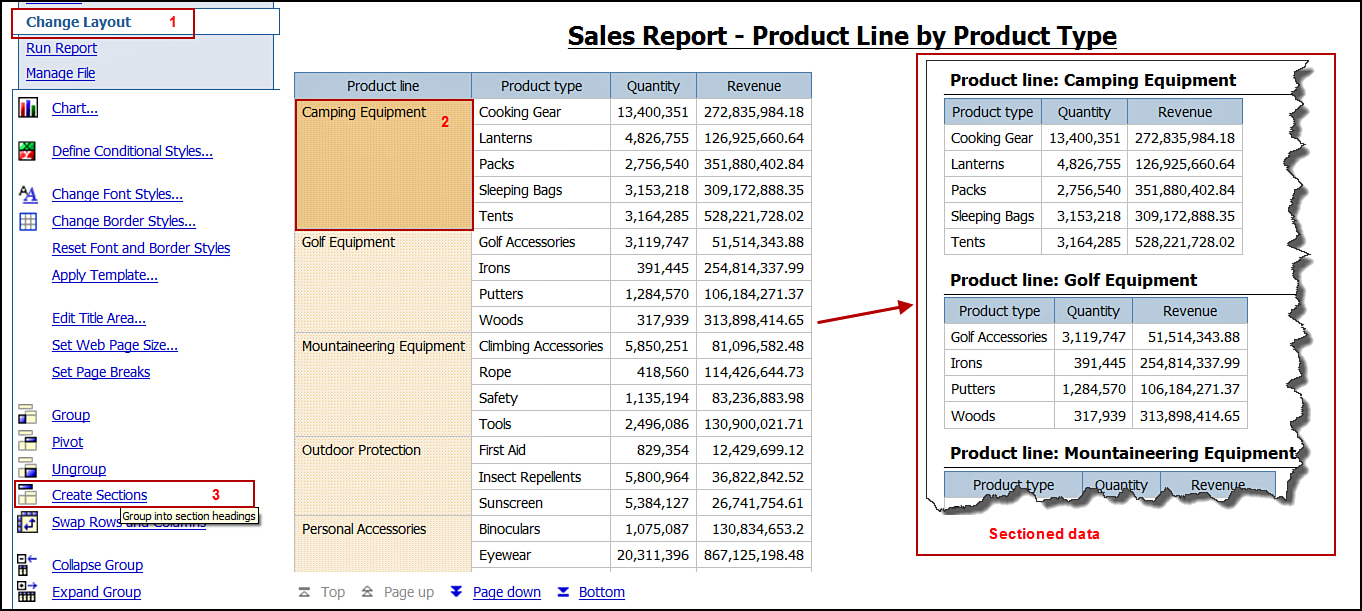
Figure 5.10. Display data in sections.
To create a section on the Product line column, click Product line column in the report > clickCreate Sections on the Change Layout menu.
NOTE: The sectioned column displays as the header and is no longer part of the list.
CREATE A CROSSTAB REPORT
Crosstab reports provide another perspective on the same data you see in the list report. You can use the Pivot option from the Change Layout menu or use the Pivot icon on the Standard toolbar to create a crosstab report, as shown in Figure 5.11. Notice in the figure that nested columns provide a wider perspective to the same data.
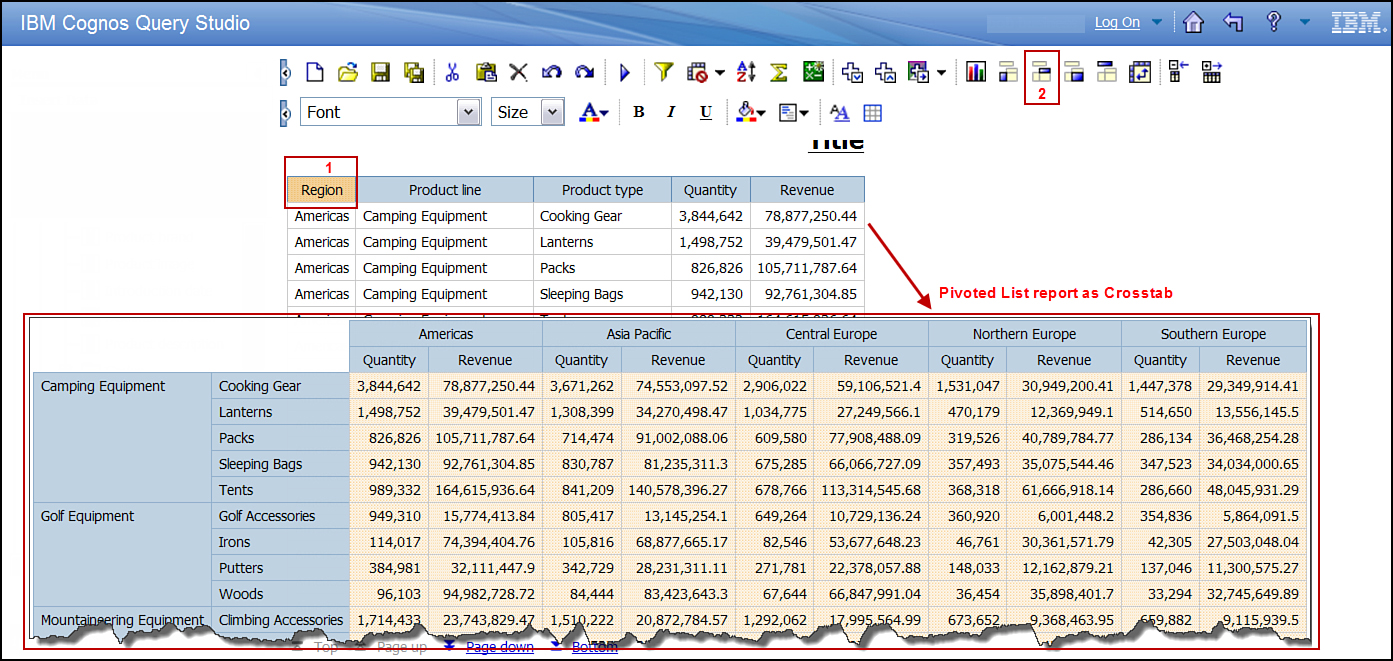
Figure 5.11. Create a Crosstab report via the Pivot option.
1. Click the New icon on the Standard toolbar to create a new report.
NOTE: This example uses GO Data Warehouse (query) package.
2. Expand Retailers > locate Region.
3. Click the Insert button.
4. Ctrl+click Products > Product line, Product type.
5. Ctrl+click Sales fact > Quantity and Revenue > click the Insert button.
6. Click the Region column > click the Pivot (Creates a Crosstab) icon on the Standard toolbar.
NOTE: The List report is now pivoted to a Crosstab report. The column you select when you choose Pivot becomes the column in the Crosstab. All measures are nested.
To switch the values currently displayed as rows to columns and columns to rows for another perspective of the data, you can use this option, as shown in Figure 5.12.
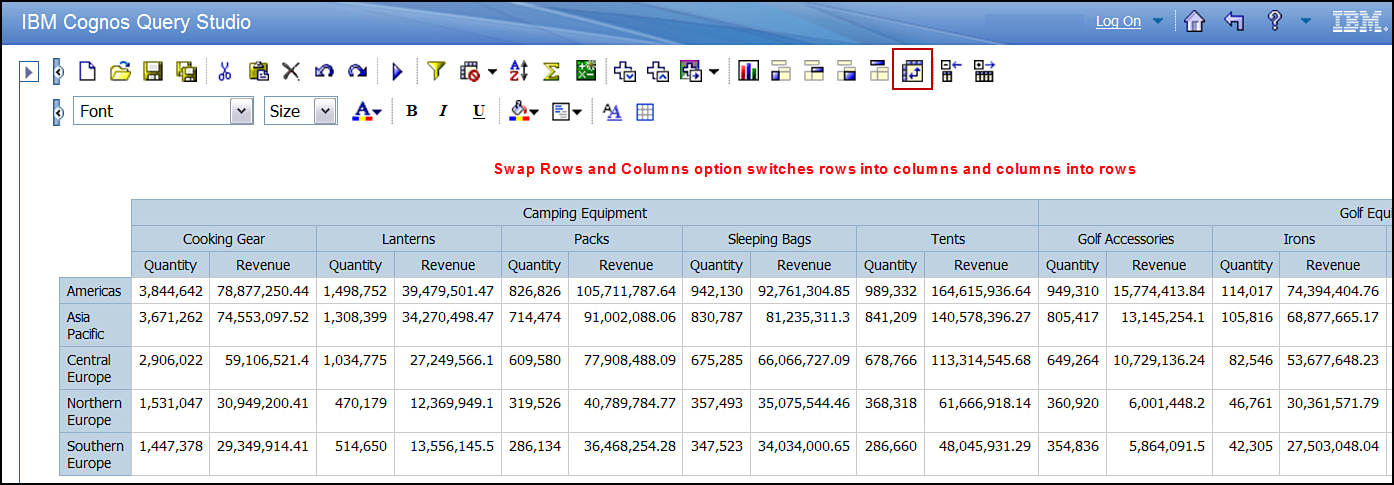
Figure 5.12. Swap rows and columns.
7. Click the Swap Rows and Columns icon on the Standard toolbar.
NOTE: The rows become columns and columns switch to rows. The measures remain at the intersection.
CREATE FILTERS
You can create filters to display data that is relevant and remove unwanted data from the report, as shown in Figure 5.13 and outlined in the list that follows.
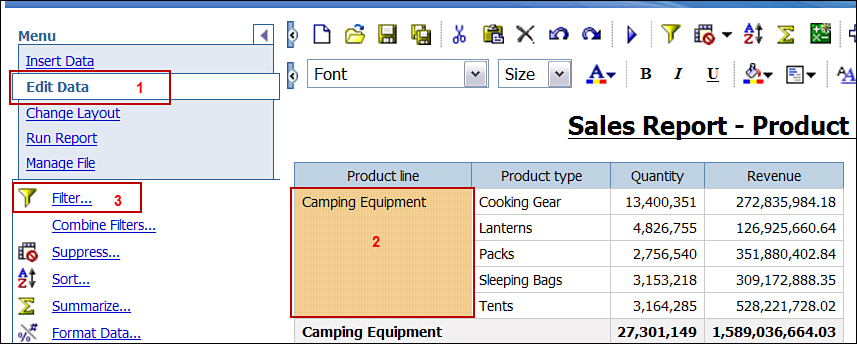
Figure 5.13. Create Filter on the Product line column.
1. Click the New option on the Standard toolbar to create a new report.
NOTE: This example uses GO Data Warehouse (query) package.
2. Insert Products > Product line into the report.
3. Insert Products > Product type into the report.
4. Insert Sales fact > Quantity into the report.
5. Insert Sales fact > Revenue into the report.
6. Click the Product line column > click Group option on the Standard toolbar.
7. Click the Product line column > click the Filter icon on the Standard toolbar.
8. Select the check box for Mountaineering Equipment, Outdoor Protection, and Personal Accessories.
9. In the Condition section > select Do not show the following (NOT) from the drop-down list, as shown in Figure 5.14.

Figure 5.14. Create Filter options.
10. Click OK.
11. Click the filter link on top of the report.
12. Check the box for Prompt every time the report runs.
13. Uncheck Outdoor Protection.
14. Click OK.
Remove Filters
You can remove any filter currently applied to the report, as shown in Figure 5.15 and described in the list that follows.
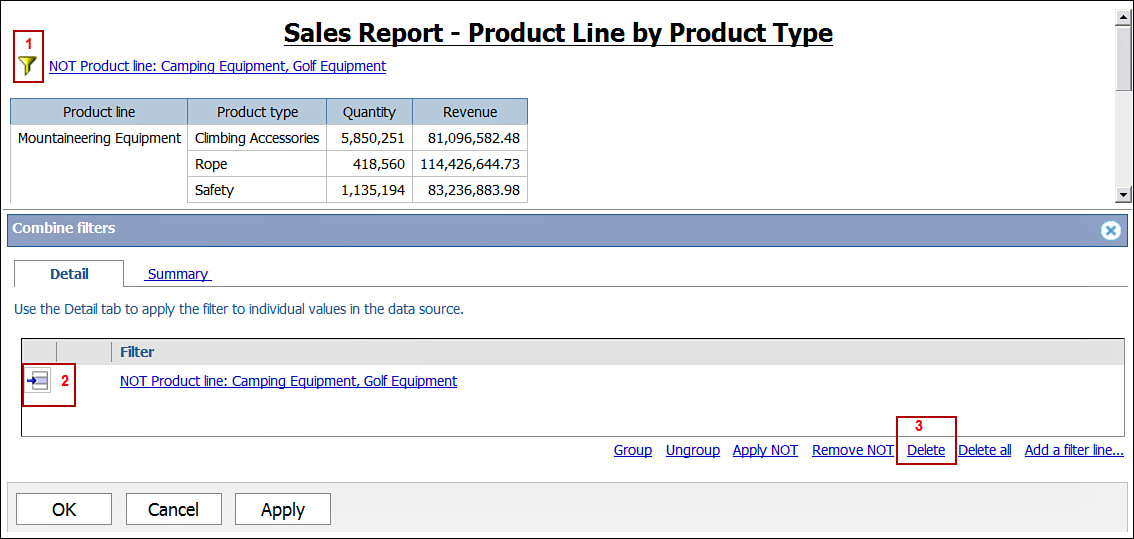
Figure 5.15. Remove filter.
1. Click the filter icon (yellow funnel) > click the existing filter > click the Delete link.
2. Click OK.
3. Save > type a name for the report SampleOutdoor Sales Report Product Line by Product Types.
NOTE: Alternatively, you can right-click the filter line and choose Delete.
Create a Complex Filter
You can create complex filters by combining two or more filters as described in the list that follows. To use this option the Advanced Query Studio capability must be enabled.
1. In IBM Cognos Connection, click Launch > Query Studio.
2. Select the GO Data Warehouse (query) package when prompted to select a package.
3. Click the New option to create a new report.
4. Ctrl+click Product line, Product Type, Quantity, and Revenue, and add it to the report via theInsert button.
5. Click Quantity column > click the Filter icon on the Standard toolbar.
6. In the Filter window, Condition section > type 3,000,000 in the From box, as shown in Figure 5.16.
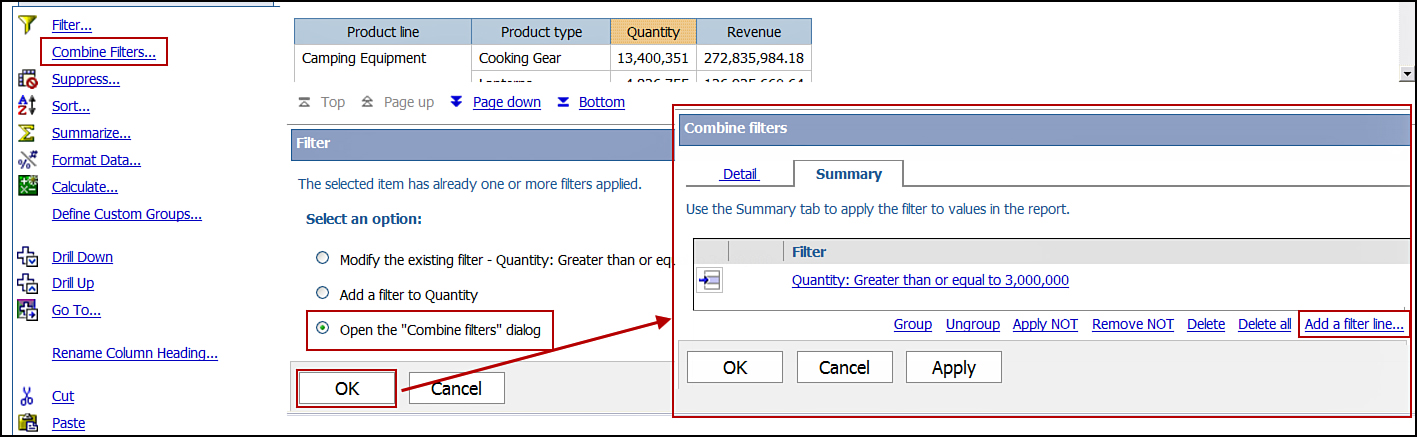
Figure 5.16. Combine filters to create a complex filter.
7. Click OK.
8. Click Edit Data menu > Filters > choose Open the Combine Filters dialog.
NOTE: Alternatively you can click Edit Data menu > Filters > Combine Filters. The example here also displays other options available to you.
9. Click Add a filter line... link.
10. In the Condition section > type 5,000,000 in the To box > click OK twice, as shown in Figure 5.17.
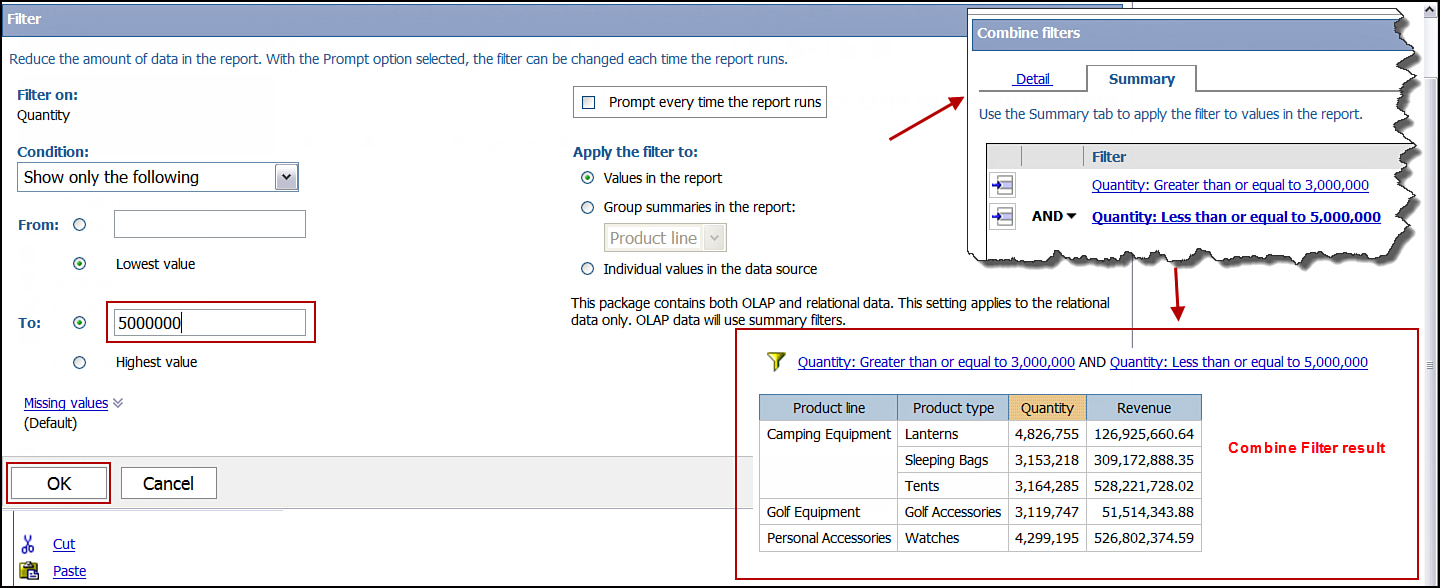
Figure 5.17. Create complex filters in Query Studio.
NOTE: All rows with quantities greater than 5,000,000 are removed from the report.
11. Click the Change Layout menu > Edit Title Area... > uncheck Show filters > click OK.
NOTE: The report does not show the filters applied to the report anymore.
SUMMARIZE REPORT
The Summarize option enables you to add or remove footer values. You can also use this option to change how the detail values are calculated in the report.
To summarize a report, perform the following steps:
1. Click the New option to create a new report.
NOTE: This example uses GO Data Warehouse (query) package.
2. Insert Product line, Product type, and Quantity in the report.
3. Click Product line > click Group option in the toolbar.
NOTE: The Quantity is automatically summarized using the Total function. This is the default.
4. Click the Quantity column header.
5. Click Edit Data menu > click Summarize.
6. In the Summarize window, choose Average.
NOTE: The Quantity is now averaged.
7. Click OK.
You can remove any summary from the report by performing the following steps:
1. Click the column header Quantity > Edit Data menu > Summarize.
2. In the Summarize window, on the Summary for Footers drop-down list > choose None.
3. Click OK.
NOTE: Navigate to the bottom of the page; notice that the footer summary has been removed.
SORT DATA
Use the Sort option to display data in ascending or descending order. You can also remove any Sort option currently applied to the report.
To sort data, perform the following steps:
1. In IBM Cognos Connection, click Launch > Query Studio.
2. Select the GO Data Warehouse (query) package when prompted to select a package.
3. Click New icon on the Standard toolbar to create a new report.
4. On the Insert Data menu, navigate to Sales > Products > Product line > click the Insertbutton.
5. On the Insert Data menu, navigate to Sales > Order Method > Order Method Type > click the Insert button.
6. On the Insert Data menu, navigate to Sales > Sales fact > Quantity.
7. Click Order Method > click the Pivot icon on the Standard toolbar.
8. Click Order Method > click the Edit Data menu. Click Sort > select Descending.
In addition, you can sort or filter items that do not appear in the report by right-clicking on the item in the metadata tree, as shown in Figure 5.18.
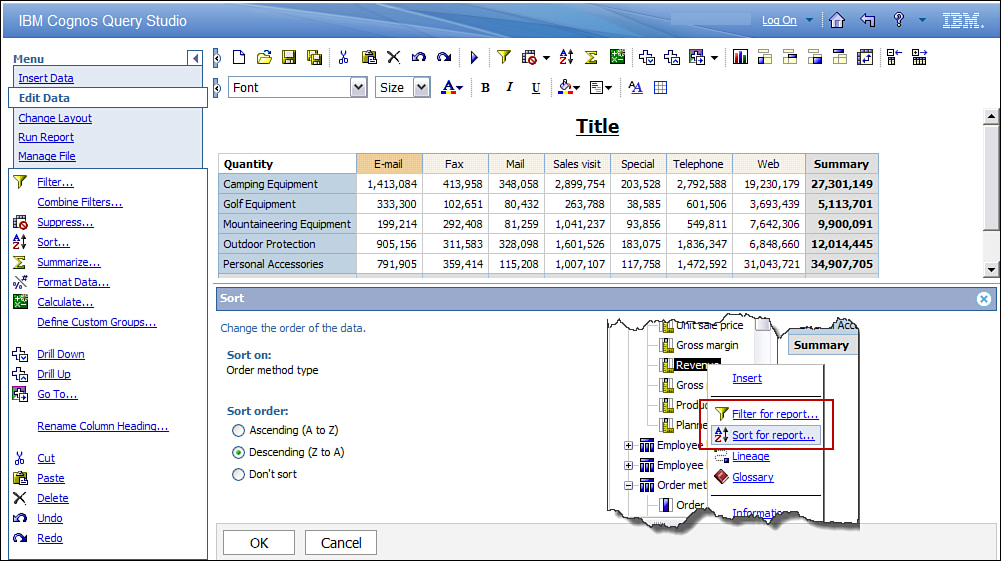
Figure 5.18. Sort or filter data items not included in the report.
CREATE CALCULATIONS
Use calculations to add derived information to the report that is not available in the database such asRanking the rows to display the top 5 or bottom 5 performers, as shown in Figure 5.19.
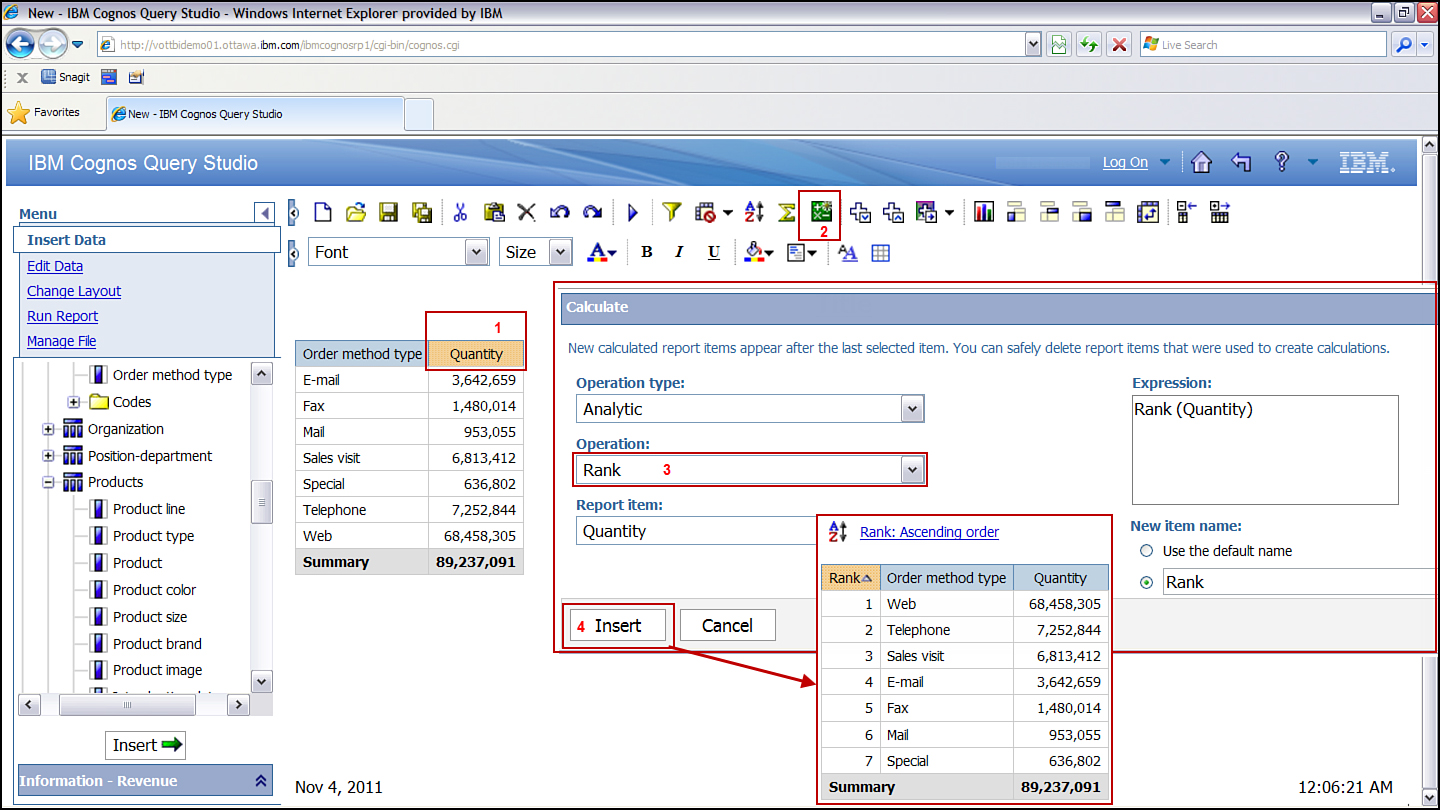
Figure 5.19. Create calculations in Query Studio.
Steps to Create Calculations
Figure 5.19 illustrates steps to create calculations in Query Studio as described in the list that follows.
1. In IBM Cognos Connection, click Launch > Query Studio.
2. Select the GO Data Warehouse (query) package when prompted to select a package.
3. Click New icon on the Standard toolbar to create a new report.
4. Expand GO Data Warehouse (query) > Sales and Marketing (query) > Sales (query).
5. On the Insert Data menu, Ctrl+click Order Method Type from Order method and Quantityfrom Sales fact > click the Insert button.
6. Click the Quantity column in Sales Fact.
7. Click the Calculate icon on the Standard toolbar.
8. In the Calculate window, select Operation type > Analytic.
9. In the Calculate window, select Operation > Rank.
10. In the Calculate window, for the New item, name the type Rank.
11. Click Insert.
12. Click the Rank column > click Cut on the Standard toolbar.
13. Click the Order Method Type column > click Paste on the Standard toolbar.
14. Click the Rank column > click the Edit Data menu > Sort > Ascending.
Calculations cannot be edited, and therefore if they are incorrect, you must delete and re-create them as required.
You can create complex calculations by creating multiple calculated items, for example, calculation A and calculation B. You can then create calculation C based on calculation A and calculation B. Finally, if you want to display only the final calculation, that is, calculation C, then you can delete calculation A and calculation B from the report.
Define Custom Groups
Custom groups enable you to create grouping in data not already defined in the data source, as shown in Figure 5.20.
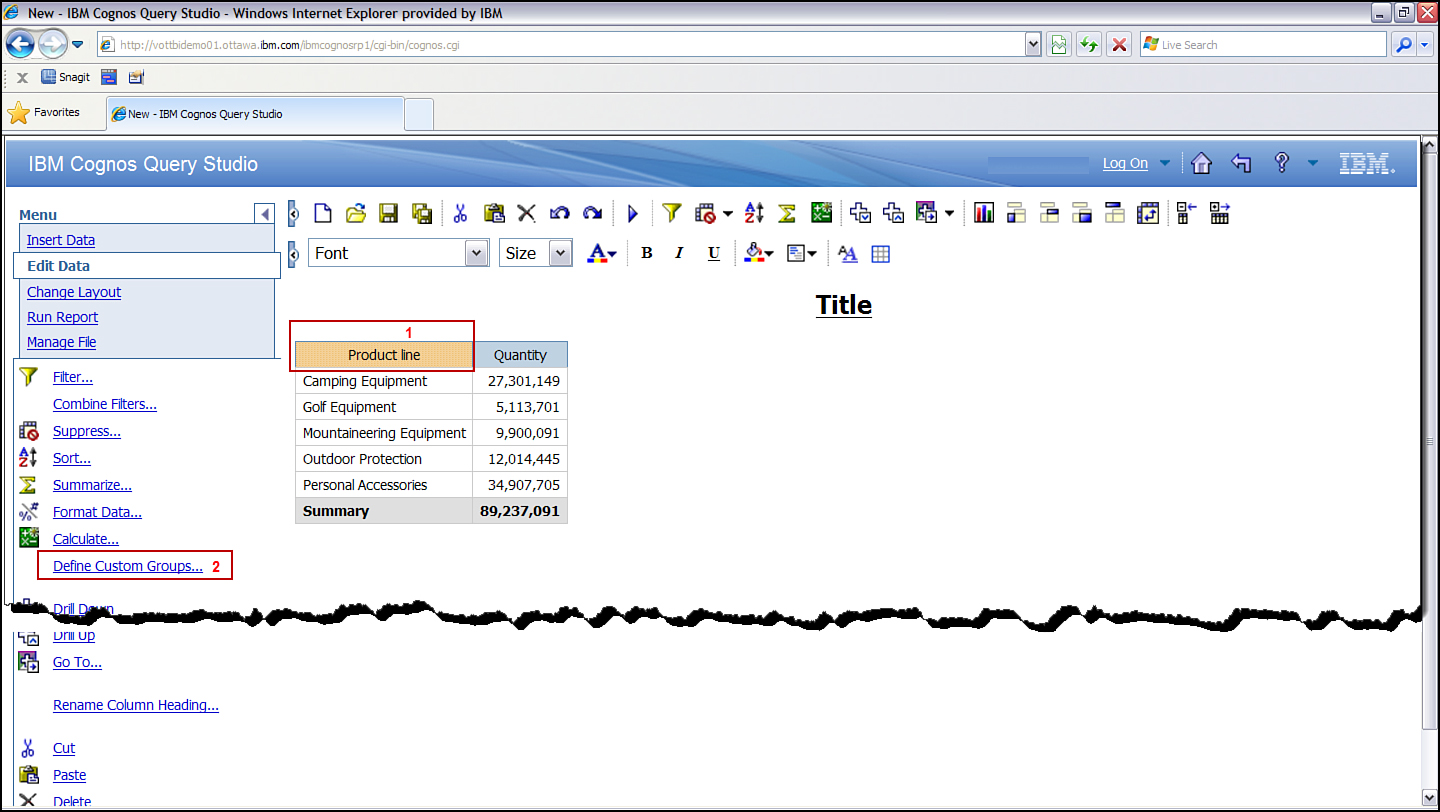
Figure 5.20. Create custom groups in Query Studio.
To create custom groups, perform these steps:
1. In IBM Cognos Connection, click Launch > Query Studio.
2. Select GO Data Warehouse (query) package when prompted to select a package.
3. Click the New icon on the Standard toolbar to create a new report.
4. Expand GO Data Warehouse (query) > Sales and Marketing (query) > Sales (query).
5. Expand Products > click on Product line > click Insert.
6. Expand Sales fact > click Quantity > click Insert.
7. Select the Product line column.
8. In the Edit Data menu > click Define Custom Groups.
9. In the Define custom groups window, in the New group name box, type Summer Promotion > click the down green arrow to move it to the Custom groups box, as shown in Figure 5.21.
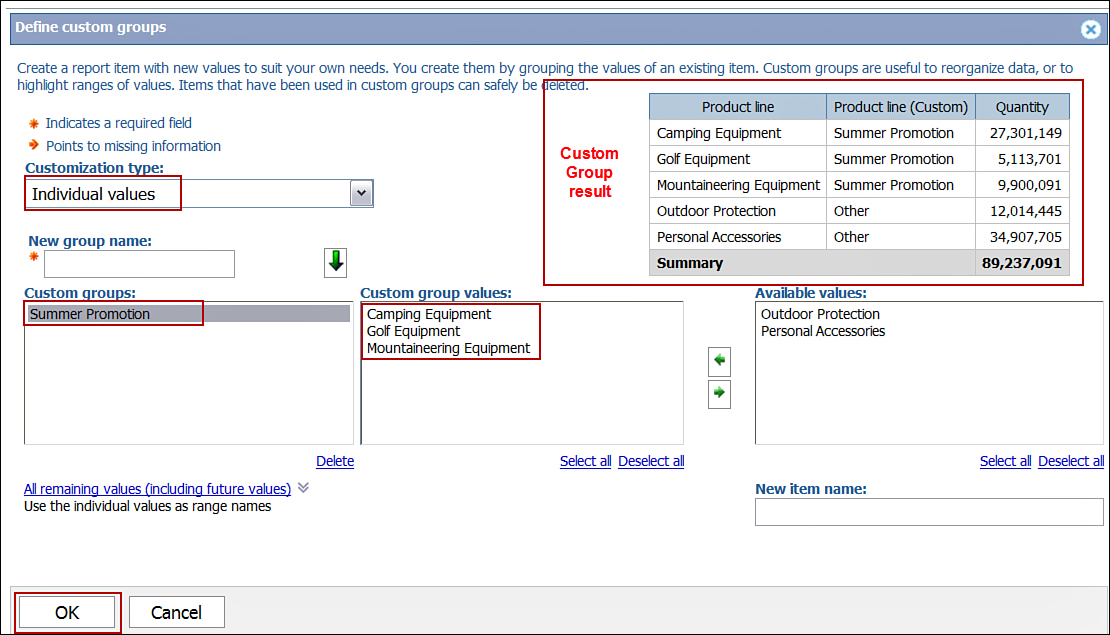
Figure 5.21. Custom group options and results.
10. In the Available values box, Ctrl+click Camping Equipment, Golf Equipment, andMountaineering Equipment > click the left green arrow to move it to the Custom group values box.
11. In the New group name box, type Other to group all remaining values > click the left green arrow to move it down to the Custom group values box.
12. In the Available values box, Ctrl+click remaining values, that is, Outdoor Protection andPersonal Accessories.
13. Click OK.
NOTE: A new column Product line (Custom) is added with values Summer Promotion and Other as defined, as shown in Figure 5.21.
CREATE CHARTS
Charts enable you to display the data graphically and highlight the trends and relationships in the data that are not clearly visible in a report. When working with charts, Query Studio provides options to display the Chart only, or both the Chart and a table.
You can create Column, Bar, Pie, Line, Column-Line, Area, and Radar chart types in Query Studio. For each of the chart types other than Pie and Radar, you can choose them to be Standard, Stacked, or 100 Percent Stacked. Further customization options are available for charts depending upon the chart type selected.
Some points to consider when choosing a chart type are as follows:
• Column charts are useful when you want to compare data or see trends over time.
• Pie charts are a good option to display a contribution of the parts to the whole. It can plot only one data series; if you require more than one, you should use another type and choose 100 Percent Stacked. When you display the report in PDF or HTML, you can show 16 pies or gauges per chart. For Pie charts you can choose from one of the four chart types: Standard, 100%, Standard with 3-D Visual Effect, and 100 Percent with 3-D Visual Effect configurations.
• Line, Column, Area, and Bar charts are commonly used to display trends in time or contrast values across different categories.
• Column-Line charts are typically used to compare different kinds of quantitative information.
• Radar charts are typically used to compare groups of related information against actual values.
To create charts, perform the following steps:
1. In IBM Cognos Connection, click Launch > Query Studio.
2. Select GO Data Warehouse (query) package when prompted to select a package.
3. Click the New icon on the Standard toolbar.
4. Expand GO Data Warehouse (query) > Sales and Marketing (query) > Sales (query).
5. Expand Retailers > click Region > click the Insert button.
6. Expand Sales fact > click Revenue > click the Insert button.
7. Click the Chart icon on the Standard toolbar.
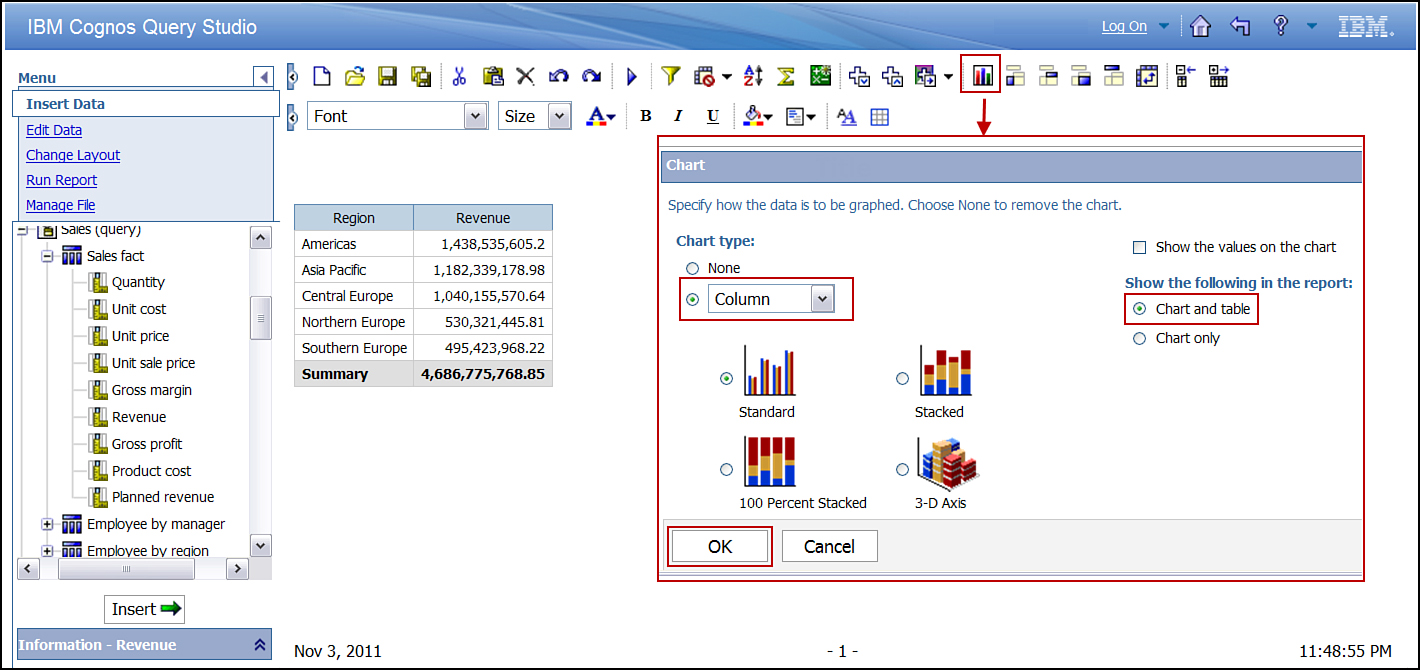
Figure 5.22. Chart and table in a report.
9. Click OK.
10. Expand Products > drag and drop Product line to the right of Region (as the middle column).
NOTE: The chart was automatically updated.
11. Click anywhere in the list > click the Pivot icon on the toolbar to create a crosstab report.
12. On the toolbar, click the Swap Rows and Columns icon > click OK.
NOTE: You can swap the rows and columns for either the chart or the list or both (default).
NOTE: The report now contains both the Chart and List reports. If you have a Crosstab report, you can also change the perspective by using the Swap Rows and Columns option, as shown in Figure 5.23.
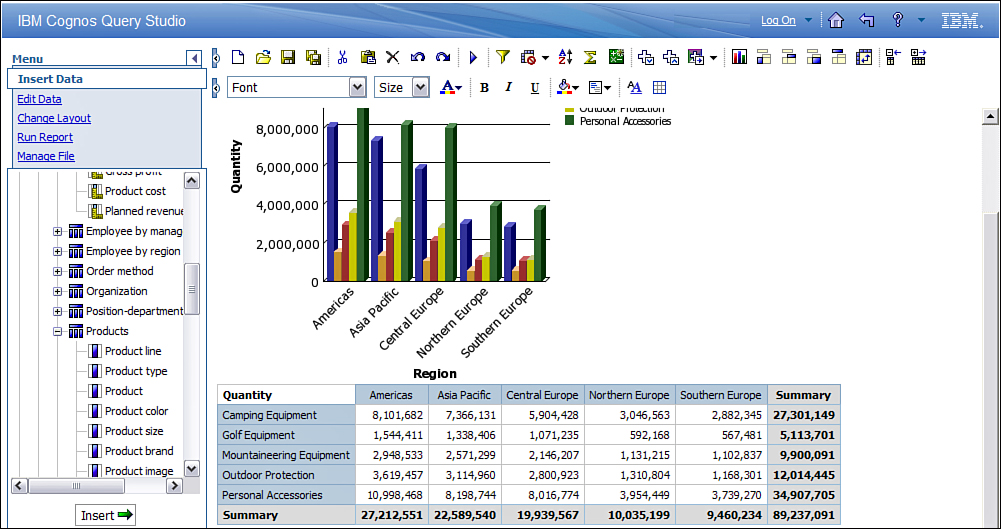
Figure 5.23. Swap Rows and Columns on the List.
DEFINE CONDITIONAL STYLES
Conditional styles are used to highlight important information in the report. For example, you can choose to display all quantities < 500,000 as red and all quantities > 5,000,000 as green. This quickly highlights the ones that are not doing that well in the report. You can define thresholds that are meaningful to your business, as shown in Figure 5.24. You can define conditional styles for numeric, text, and date values.
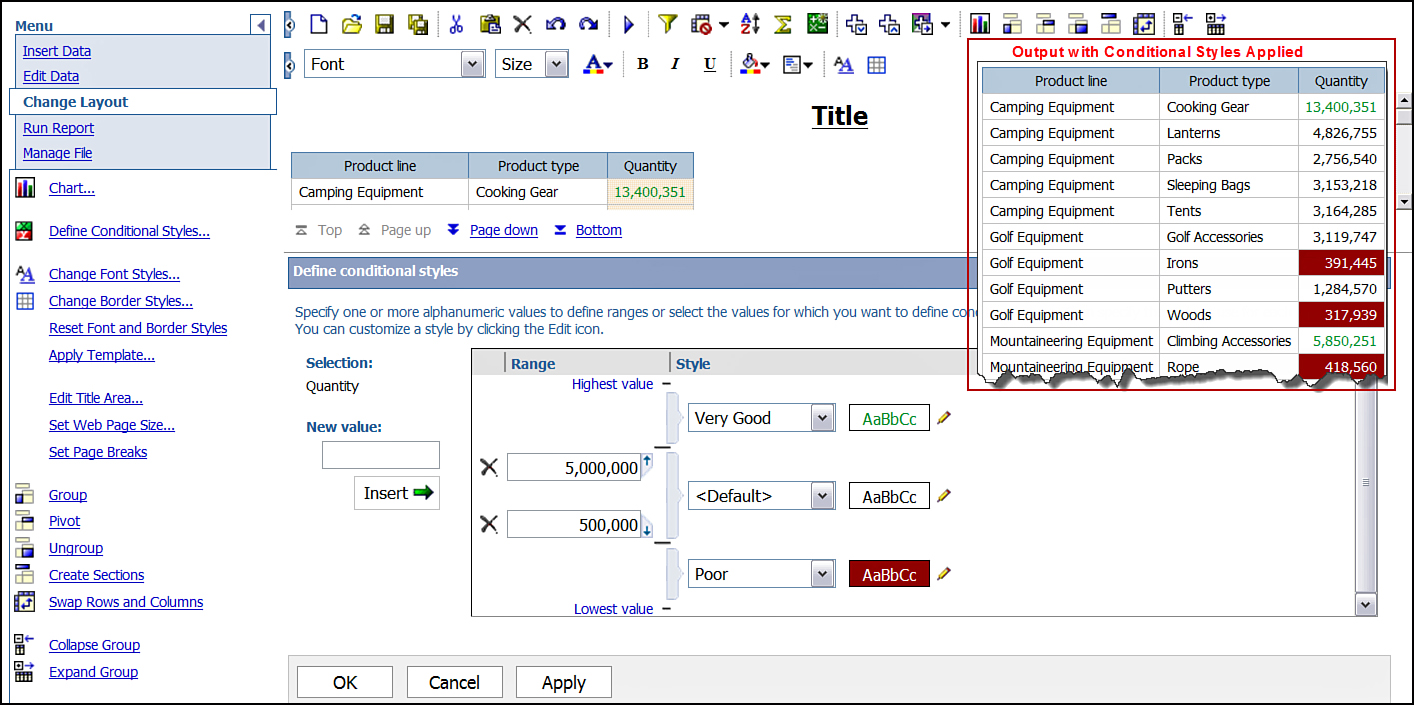
Figure 5.24. Define conditional styles to highlight quantity.
To define conditional styles, perform the following steps:
1. In IBM Cognos Connection, click Launch > Query Studio.
2. Select the GO Data Warehouse (query) package when prompted to select a package.
3. Click the New option to create a new report.
4. Select GO Data Warehouse (query) > Sales and Marketing (query) > Sales (query).
5. Expand Products > add Product line, Product type to the report via the Insert button.
6. Expand Sales fact > click Quantity > click Insert button to the report.
7. In the report, click Quantity.
8. Click the Change Layout menu > click Define Conditional Styles.
9. In the Range column, in the New value box, type 5,000,000 > click Insert.
10. In the Range column, in the New value box, type 500,000 > click Insert.
11. In the Style column, for 5,000,000 from the drop-down list > select Very good. You can change the color using the pencil icon; the default is green.
12. In the Style column, for 500,000 from the drop-down list > select Poor. You can change the color using the pencil icon; the default is red.
13. Click OK.
NOTE: Notice that the rows with quantities > 5,000,000 are marked green and the rows with quantities < 500,000 are marked red. You can change both foreground and background colors to match your requirement.
IN A NUTSHELL: REVIEWING BY IBM COGNOS BI AUDIENCE
Depending on your role in IBM Cognos BI project implementation, you may be interested to know those aspects of IBM Cognos Query Studio that relate to your role on the project. Following points review IBM Cognos Query Studio by role at a high level.
Architect Perspective
Architects are interested to know the capabilities of the product, so they can appropriately recommend a tool or component for the overall BI implementation. Query Studio is a core component of IBM Cognos BI and is installed with the Cognos BI software install. Query Studio is an end user ad-hoc query tool suited for business authors and business analysts to help them explore the data for their various business questions. It uses the existing IBM Cognos BI security and data sources already defined in the IBM Cognos BI environment. Some of the key points to consider follow:
• Cognos Workspace Advanced is the logical upgrade path for Query Studio for IBM Cognos BI v10.x users. For new customers, Cognos Workspace Advanced instead of Query Studio is recommended. For legacy IBM Cognos 8.x customers, they can continue to use existing reports in Query Studio; however, it is recommended to use Cognos Workspace Advanced for creating brand new reports.
• Query Studio is an end-user tool and can be used as soon as the metadata package has been published to IBM Cognos Connection.
• Query Studio can use dimensionally and relationally modeled data from Framework Manager.
• Query Studio is an ad-hoc query and data exploration tool that can be recommended to business users.
Project Manager Perspective
Project Managers are interested in knowing if Query Studio has been identified and recommended as part of the IBM Cognos BI solution. If it will be used, what are the related tasks, what skills and resources are required to implement the tasks, and what phase do these belong to? Here are some points to consider:
• Cognos Workspace Advanced is the recommended upgrade path for Query Studio for IBM Cognos BI v10.x users. Legacy IBM Cognos 8.x users can use their existing Query Studio reports from the IBM Cognos BI 8.x environment in the IBM Cognos BI v10.x environment after the upgrade.
• Query Studio is an end-user tool for data exploration and ad-hoc query to answer quick business questions and is targeted for business users and business analysts.
• Business users can start using Query Studio as soon as the Framework Manager package is published by the metadata modeler. It does not require any other task to be completed before users can start using Query Studio in a nonsecured environment. If the package contains sensitive data, the package must be secured in an IBM Cognos BI environment before turning it over to the end users.
• Query Studio is part of the IBM Cognos BI software install and does not need to be purchased separately.
Business Analyst Perspective
Business Analysts should be familiar with the features of Query Studio and Cognos Workspace Advanced, so they can guide the end users appropriately. Cognos Workspace Advanced is the logical upgrade path for Query Studio users in IBM Cognos 8.x environment. Customers upgrading from IBM Cognos 8.x environment can use their existing queries and reports in IBM Cognos v10.x environment using Query Studio in the new environment. For new queries and reports, it should be recommended that they use Cognos Workspace Advanced. Using Cognos Workspace Advanced, they can use the enhanced features available to them. Some of the key points to consider follow:
• Query Studio is an end-user tool for business users and business analysts to help them answer their many business questions by dragging and dropping items to the report, applying filters, and creating calculations.
• Query Studio uses dimensionally and relationally modeled data. For dimensionally modeled data, the dimensions, hierarchies, levels, and measures (metrics or Key Performance Indicators), the requirement should be clearly understood and captured to enable the metadata modeler to build appropriate package.
• Users can also access reports with detail data via the drill-through options. If such need exists you should gather the requirement pertaining to these drill through reports and document it appropriately.
• If the data in the Framework Manager is sensitive and should not be accessible by all, understand the requirements and document it for the Cognos development team to help them secure the metadata appropriately.
Developer Perspective
Developer refers to the Cognos development team. Some points to consider for Query Studio implementation are highlighted here:
• Query Studio works with dimensionally as well as relationally modeled data; ensure the package is built using the appropriate style.
• Capture the dimensions, hierarchies, levels, and measures per requirements, if the package is to be modeled dimensionally.
• Appropriate drill-through reports exist and have the required permissions for user access.
• Ensure filters and filter values are set up for efficient query execution when filtering on non-indexed or non-numeric columns.
• Ensure all security requirements are implemented in Framework Manager as well as IBM Cognos Connection, as required.
End-User Perspective
End User refers to business users and business analysts who will be using Query Studio to create their queries to explore and analyze data. Some of the points you should consider are listed here:
• Cognos Workspace Advanced is the logical upgrade path for Query Studio. If you are a new Cognos user (are not moving from IBM Cognos 8.x or prior versions), it is recommended you use Cognos Workspace Advanced for data exploration and querying to tap into its rich capabilities.
• If you are a legacy Cognos 8.x user now upgrading to IBM Cognos BI v10.x, Cognos Workspace Advanced is the logical upgrade path you should consider for creating new reports.
• Query Studio works with both relationally and dimensionally modeled data. Share with the Business Analyst or Cognos development team your requirements for the different paths relevant to your reports, the metrics/KPIs you want to monitor, and so on, so they can be made available in the metadata package to fulfill your reporting needs. These requirements tell the metadata modeler how the data should be structured in the package to address your data exploration and reporting needs.
• If the metadata has sensitive information and should not be accessible by all, you must clearly communicate the security needs to the Business Analyst/IBM Cognos BI Administrator/Cognos development team, as appropriate in your organization.
IBM Cognos BI Administrator Perspective
IBM Cognos BI Administrators should work together with the team to ensure that the Cognos BI system can cater to those needs with the existing Cognos BI installation. There are many situations when a choice has to be made between easy to implement and easy to maintain; you can help the team make the right decision based on the infrastructure, unique customer situation, and culture. Some of the points worth considering follow:
• Ensure Query Studio is accessible to all the users who need access.
• Is there any security requirement for who can see the metadata package required for querying and reporting in Query Studio?
• Ensure packages that must be accessed by Query Studio have been modeled with end users in mind.
well explained.Keep updating Cognos TM1 online training Bangalore
ReplyDeleteVery nice Blog with very unique content.
ReplyDeleteThank you for sharing your awesome Blog with Us.
keep posting more advanced Posts.
cognos bi training
cognos training